Heavy Equipment Refurbishment Management: How NorthForge Stopped Guessing Margins and Started Controlling Them

If your heavy equipment refurb or rebuild operation is managing project costs in spreadsheets and cannot confirm whether a job was profitable until well after the invoice, FireFlight was built for exactly this situation.
Schedule your free consultationWho NorthForge is and what they rebuild
Based in Billings, Montana, NorthForge Heavy Equipment Rebuilders specializes in the refurbishment and rebuild of large excavators, all-terrain and rough-terrain cranes, and front loaders and haul trucks used in mining and heavy construction. Their model combines a central rebuild shop equipped for full teardown, machining, structural welding, and final assembly with a field service team that travels to mines, quarries, and large infrastructure projects for diagnostics, partial repairs, and post-delivery support.
Every project is unique. Some customers buy used machinery and ask for a full like-new refurbishment. Others want focused repair on undercarriage, hydraulic systems, or structural components, with clear warranty terms, full parts traceability, and a transparent total cost of ownership. The expertise on the shop floor was never in doubt. The problem was the financial and operational infrastructure around it.
What was the problem before FireFlight?
NorthForge's mechanics knew how to strip and rebuild an excavator to the last bolt. The problem was everything around the physical work: the quoting, the parts tracking, the hour attribution, and the financial picture that only assembled clearly after the fact, if at all.
Unknown scope until teardown. Every refurb started with an estimate built on photos, partial history, and a surface inspection. The real BOM, what actually needed replacing versus what could be reconditioned versus what was failing inside, only became clear once the machine was open. Quotes were built on assumptions that teardown regularly contradicted. Scope changes were constant and only partially captured in any system. No structured record existed of how many hours and parts went into specific failure modes or machine types.
Parts and spares scattered across informal systems. NorthForge carried substantial inventory of reconditioned hydraulic pumps, cylinders, axles, seal kits, critical hardware, and electronic components. The true picture of stock lived in a basic shelf system, the memory of the warehouse manager, and several spreadsheets that were not connected to active projects. Mid-assembly, it was common to discover incomplete kits, parts verbally reserved for another job that were no longer available, and emergency purchases made at high prices just to meet a delivery date.
Project costs that did not reflect reality. Technician hours were recorded on paper or via informal messages. Many parts were pulled from stock with no clear link to a specific project. Rework and adjustments went unrecorded. Some projects looked profitable on the invoice but quietly destroyed margin in practice. Others looked expensive to the customer but were NorthForge's best jobs when viewed through true total cost of ownership. Leadership could not tell the difference until it was too late to do anything about it.
Heavy equipment refurbishment without parts traceability carries warranty and liability exposure that only surfaces after a field failure. When a rebuilt excavator fails on a job site, the question of which parts were installed, when, and by whom is not just operational. For equipment operating in mining or large infrastructure environments, it is a safety and legal question. FireFlight's structured teardown workflow and project-level parts records provide the documented traceability that supports warranty claims and protects NorthForge when a customer calls about a field issue months after delivery.
How FireFlight was built around NorthForge's refurb model
NorthForge implemented FireFlight with a clear goal: stop surviving job by job and start running the refurb portfolio as a data-driven operation where every decision rests on real information. The deployment was built around three pillars: true job costing at the project level, inventory control centered on critical spare parts, and Asset Management to track lifecycle and total cost of ownership over time. Configuration was completed in weeks, not months.
Intake, Evaluation, and Project Work Orders
Every project begins in FireFlight as a Project Work Order tied to a specific asset. The machine's serial number, known history, operating hours, site conditions, and reported failure modes are registered from day one. Sales and operations define an initial scope with likely components to address and an estimated cost range. That Project Work Order links to the customer record, the asset's EAM record, and the sites where the machine operates.
From day one, there is a single container for everything that follows: notes, photos, decisions, approvals, and costs. Nothing lives in a separate email thread or on a whiteboard.
Structured Teardown with a Live BOM
When the machine hits the shop, teardown becomes a structured digital workflow rather than an undocumented technical process. Each subsystem, including undercarriage, engine, hydraulics, structure, and electrics, has defined steps inside FireFlight. Technicians log findings, upload photos, and mark components as reuse, recondition, or replace.
As teardown progresses, the BOM for the project is built directly from actual findings in FireFlight. Replacement decisions trigger inventory reservations or purchase requisitions, all tied back to the Project Work Order. The scope that previously existed only in the shop supervisor's head becomes a documented, traceable record.
Spare Parts Inventory Connected to Active Projects
Every component, from major assemblies down to seal kits, is cataloged in FireFlight with alternates, preferred vendors, and lead times. Every stock movement is recorded against a specific project and asset. When a BOM is confirmed, FireFlight checks what is on hand, what is already reserved for other projects, and what needs to be ordered.
The result is fewer mid-assembly surprises and a growing historical dataset on which parts are used most frequently in which repair types and at what margin impact. That dataset feeds future quoting accuracy.
Real-Time Job Costing and Project Financial Dashboard
Technician hours are logged directly to each project and, when relevant, to specific sub-tasks such as cylinder rebuild, structural weld repair, or hydraulic testing. Outside services flow from accounts payable into the Project Work Order. Parts leave inventory with actual cost attached to the same project.
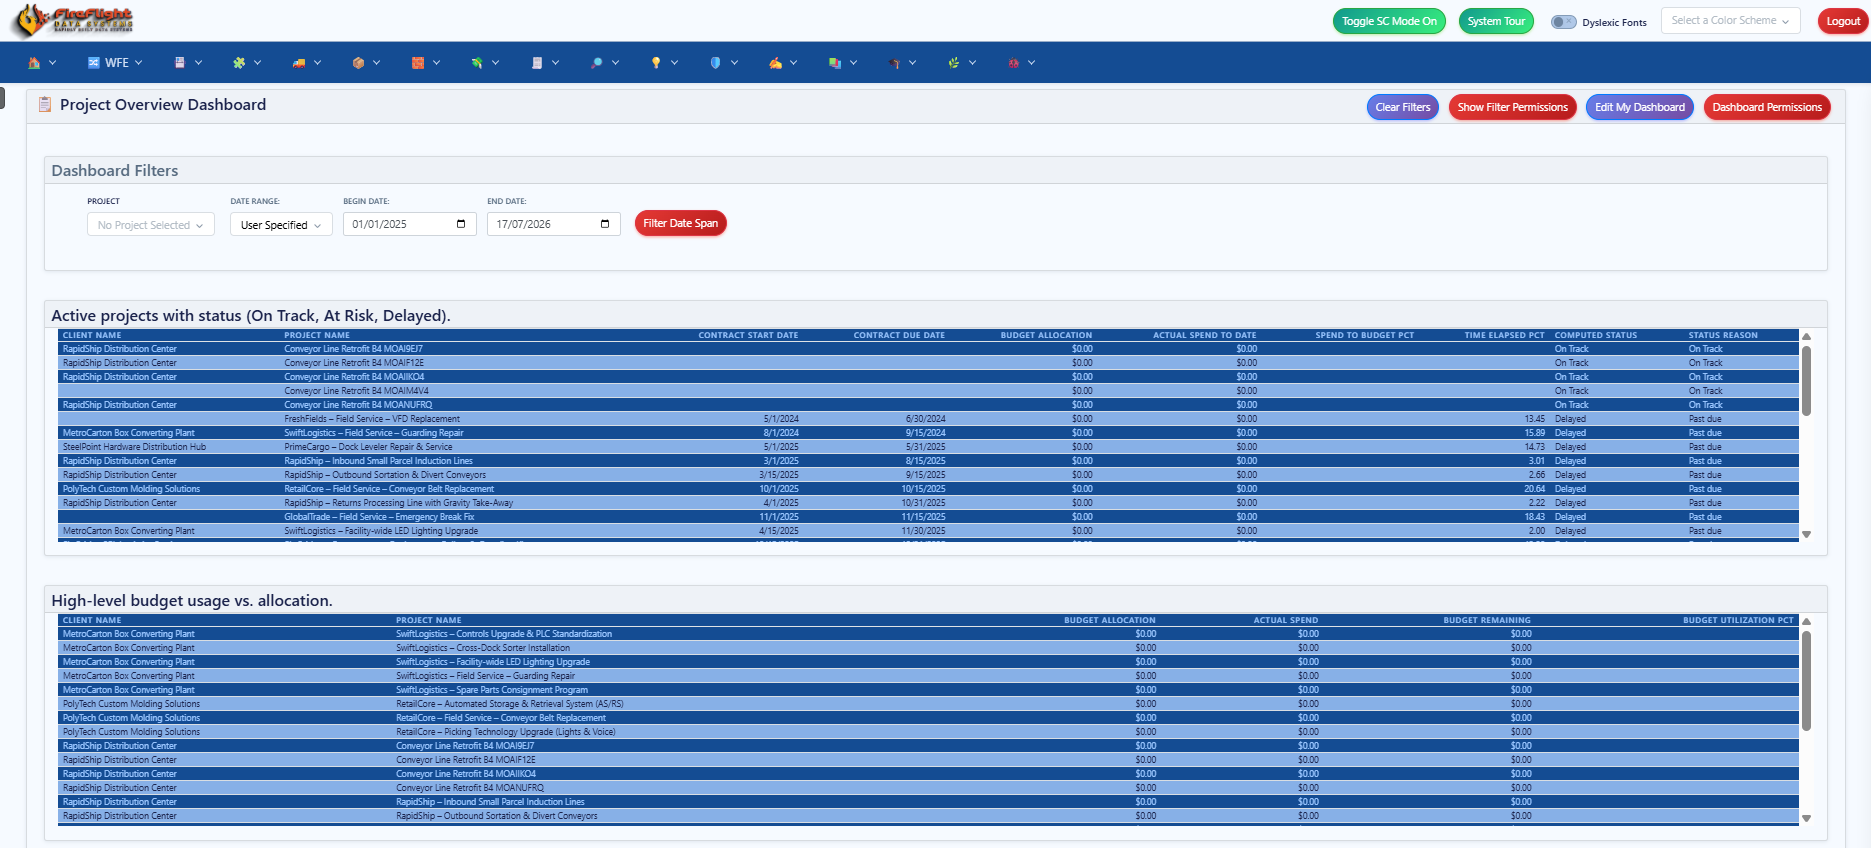
On the project financial dashboard, leadership sees material cost versus plan, projected margin versus original quote, estimated versus actual technician hours, and approved scope changes with their financial impact. NorthForge moved from waiting for month-end to monitoring the financial health of every active refurb while it is still in progress.
Asset Lifecycle and Total Cost of Ownership
Each refurbished asset carries a full intervention history in FireFlight: cumulative cost over time, all installed parts with dates and warranties, and operating hours gained with each refurb cycle. When a customer asks whether another refurb is worth more than buying a new machine, NorthForge opens FireFlight and shows the complete picture: how much has been invested in that specific asset, how its total cost of ownership compares to a replacement machine, and how many operating hours each previous refurb produced.
That turns NorthForge from a shop into a strategic advisor for fleet decisions.

FireFlight capabilities active at NorthForge
Every refurb starts as a Project Work Order tied to the specific asset's EAM record. Machine history, operating hours, failure modes, and all subsequent decisions, costs, and findings accumulate in one place from intake to delivery.
Subsystem-by-subsystem teardown steps with technician findings, photos, and component disposition logged in FireFlight. The BOM builds from actual teardown data. Nothing lives in a shop supervisor's head or a paper note.
Parts issued from stock are recorded against the specific project and asset that consumed them. Before assembly, FireFlight confirms what is available, what is reserved elsewhere, and what needs to be ordered. Emergency mid-assembly purchases are replaced by planned procurement.
Material cost vs. plan, projected margin vs. quote, actual vs. estimated hours, and scope change impact all visible in real time during active projects. Margin-eroding jobs no longer hide inside monthly averages until it is too late to act.
Cumulative investment history per asset across all refurb cycles. Total cost of ownership calculated and comparable to replacement machine acquisition cost. Operating hours gained per refurb documented and available for customer fleet decision conversations.
Field service team diagnostics, partial repairs, and post-delivery support recorded in the same system as shop-based refurb projects. Every intervention on an asset, whether in the shop or in the field, attaches to the same asset record.

What changed after deployment
Within a year, the operation felt different at every level. On the shop floor, technicians still focused on the physical work, but every step left a documented trail. Conversations shifted from "who grabbed that cylinder?" to "why does this type of repair consistently run over estimated hours?" That second question was not answerable before FireFlight because the data to answer it did not exist in any structured form.
In management and finance, the patterns that had been invisible inside monthly averages became visible. Specific brands, models, machine ages, and operating conditions that consistently eroded margin were identified by name. Pricing and scope adjustments on future quotes for those machine types were made from historical cost data rather than intuition.
In customer relationships, NorthForge gained the ability to explain exactly why a refurb costs what it does: teardown findings, decisions made during the process, parts installed, test results documented. Some customers began using FireFlight's reports internally to justify their own refurb investment versus buying new decisions to their leadership teams.
- Project margin became visible in real time rather than at month-end. Jobs that were quietly destroying margin were identified while still on the floor, before invoicing locked in the loss.
- Parts surprises mid-assembly dropped significantly as inventory reservations against confirmed BOMs replaced the informal "verbal reserve" system that had been causing incomplete kits and emergency purchases.
- Quoting accuracy improved as historical cost data from completed projects revealed the actual parts and hours required for specific machine types, failure modes, and operating conditions.
- Asset TCO documentation gave NorthForge a differentiated service offering: the ability to show customers a complete investment history per machine and a data-supported recommendation on whether another refurb or a replacement machine is the right financial decision.
- Field service interventions and post-delivery support were recorded in the same asset record as the original refurb, giving NorthForge a complete operational picture of every machine in its portfolio over time.

What we learned from this deployment
The BOM problem in heavy equipment refurbishment is not a systems problem. It is a structural reality of the work: the scope of a refurb reveals itself during teardown, not before it. Any system that requires a fixed BOM before work begins will either produce inaccurate quotes or create an incentive to under-scope to win the job and then absorb overruns. FireFlight's teardown workflow builds the BOM from actual findings rather than assumptions, which aligns the documentation system with how heavy equipment refurbishment actually works.
The insight that applies to any heavy equipment repair and refurb operation: project-level job costing is not the same as monthly cost tracking. Monthly totals tell you whether the business made money last month. Project-level job costing tells you which jobs made money and which ones did not. NorthForge's management needed the second number, not the first. The average of a set of profitable and margin-destroying jobs looks acceptable in aggregate. Individually, the margin-destroying jobs set a pattern that explains why certain machine types, brands, and operating conditions should be priced differently. That pattern only becomes visible when the cost data is attached to specific projects, not averaged across a month.
The TCO advisory capability is worth addressing directly. When NorthForge can show a customer the complete investment history for their specific machine, including what every refurb cost, what operating hours each produced, and what the cumulative TCO looks like against a new machine, the conversation changes. NorthForge moves from being the vendor who does the work to being the advisor who helps the customer make the right fleet decision. That positioning is not available to competitors who cannot produce that documentation. FireFlight does not create that expertise. It makes it visible.
Deployments for heavy equipment refurb and rebuild operations covering project work orders, teardown workflow documentation, spare parts inventory linked to active projects, real-time job costing, and asset lifecycle tracking are completed in weeks, not months. The configuration built for NorthForge applies directly to any operation managing complex, unique rebuild projects where scope discovery happens during the work rather than before it starts.
Frequently asked questions
 Can FireFlight handle project work orders for heavy equipment refurbs where the scope is not fully known until teardown begins?
How does FireFlight's live BOM work when component replacement decisions are made during teardown?
Can FireFlight track spare parts inventory against specific refurb projects rather than as general stock?
How does FireFlight give management real-time project margin visibility during active refurbs?
Can FireFlight track total cost of ownership for a specific machine across multiple refurb projects over its lifetime?
How does NorthForge use FireFlight to advise customers on refurb versus replacement decisions?
How long does a FireFlight deployment take for a heavy equipment rebuilder?

The company name in this use case has been changed to protect client information. The operational scenario and outcomes described represent a documented FireFlight deployment.
Ten Conveyor Lines, One System
How GlobalRoll Conveyance Systems replaced whiteboards and spreadsheets with a complete build-to-order manufacturing system on FireFlight, across two plants in Dayton, Ohio.
The company name in this case study has been changed to protect client information. The operation, configuration, and outcomes are real.
One view across ten product lines and two plants, replacing the whiteboard and the spreadsheet stack.
Who is GlobalRoll and what do they build?
GlobalRoll Conveyance Systems produces rollers and fabricated subassemblies that form the backbone of ten major conveyor product lines. Their headquarters sit on Precision Drive in Dayton, Ohio, with manufacturing spread across a West Campus facility handling machining, fabrication, coating, and roller assembly, and a Distribution and QA Center managing inspection, testing, packing, and shipping.
Each conveyor product blends fabricated steel structures, machined rollers, drive assemblies, sensors, wiring, hardware, and finishing processes. GlobalRoll ships thousands of rollers and assemblies every month. The product line is highly configurable: customers routinely request variations in roller diameter, coating type, shaft configuration, bearing specifications, bracket geometry, or load rating. Before FireFlight, every one of those variations required manual BOM reconstruction, and no two quotes were built the same way.
What was breaking before FireFlight?
GlobalRoll built configurable conveyor systems, so almost every order arrived with a different roller diameter, coating, shaft, bearing, or load rating. On spreadsheets and a whiteboard, four failures kept compounding across the ten product lines.
Engineering rebuilt a bill of materials by hand for every configured order, and a change to a shared part never reached the other products that used it. Materials got consumed by other jobs with no visibility, so shortages showed up at kitting and triggered emergency runs. The whiteboard schedule reflected intent, not reality, and rush orders kept reshuffling it into stalled partial builds. Material cost sat in spreadsheets while labor stayed handwritten, so profit per product line was impossible to confirm.
What did FireFlight put in place?
PCG configured FireFlight from modules that map to how the plant actually runs, from the quote through routing to job costing. Each module reads and writes the same data, so a change in engineering reaches inventory, the schedule, and the invoice with no re-entry step.
- Engineering-Controlled BOMs and Templates: Ten product templates carry the full BOM, routing, and costing. Shared subassemblies live as reusable component templates, so one engineering change reaches every product that references them.
- MRP-Driven Inventory Forecasting: Material requirements are calculated from confirmed orders and production schedules across all ten product lines, so procurement fires before a shortage reaches kitting.
- Digital Work-Center Routing: Each product routes through tube cutting, shaft machining, welding, roller assembly, coating, wiring, and final QA, with instructions driven by real material availability and capacity.
- QA Integration and Serialization: Motors, drive rollers, and critical components are serialized and tied to QA events at each stage, so a field issue traces back to its production run in minutes.
- Parameter-Driven Real-Time Quoting: Sales generates accurate cost, material requirements, and lead time straight from the customer configuration, without waiting on engineering.
- Template-Driven Job Costing: Actual labor and material attach to every job as production runs, and rework gets captured in the system, so profit by product line becomes visible.
Ten product templates, each carrying its BOM, routing, and costing, with shared components defined once.
The modules were already built and tested, so the work was configuration, not a rebuild from zero. That is why the system went live in weeks, not months, across ten product lines and two facilities. PCG mapped the plants, configured the templates, and moved the existing data in stages while the current tools kept running, so production never stopped during the switch.
How are the two plants and work centers mapped?
GlobalRoll's operation spans two physical facilities, each with defined work centers. FireFlight mapped the full structure before go-live, creating the routing foundation that every product template references. No work-center sequence is hardcoded to a single product, so the routing logic is reusable across all ten conveyor lines.
West Campus Manufacturing
- Tube cutting
- Shaft machining
- Welding and fabrication
- Roller assembly
- Coating and finishing
- Electrical wiring
Distribution and QA Center
- Final QA inspection
- Functional testing
- Packing and labeling
- Shipping and dispatch
- Warranty and return intake
How does FireFlight structure each of the ten products?
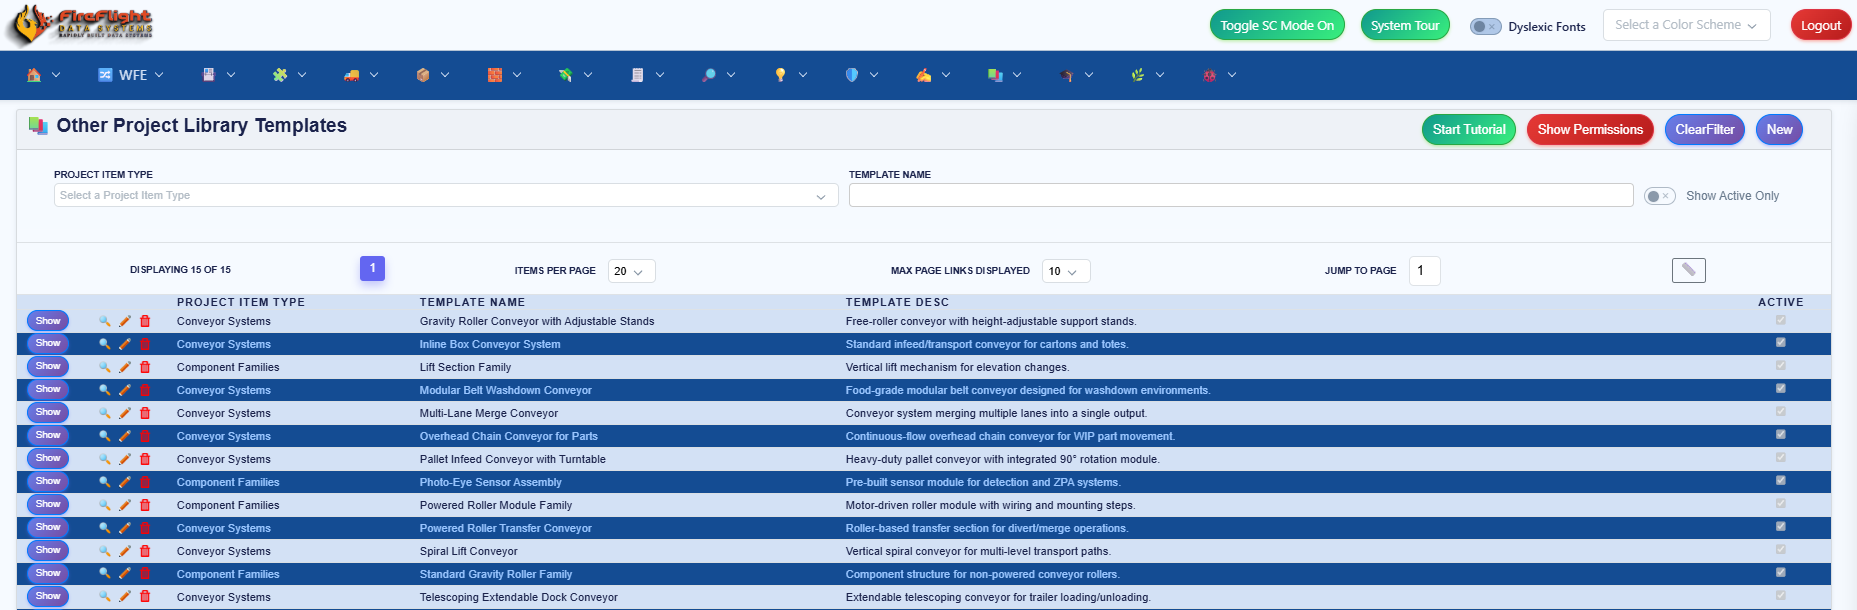
Every conveyor line runs from its own template, and the template carries the BOM, routing, and costing logic for that product. Here is how the ten lines are set up, from the most configurable to the highest volume.
- Inline Box Conveyor System. The most configurable product in the line. A template supporting hundreds of rollers, frames, brackets, and electrical components, all costed and routed automatically from length, load rating, and roller pitch inputs entered at order creation.
- Pallet Infeed Conveyor with Turntable. Load-rated rollers, fabricated steel supports, and a driven rotation assembly standardized through template logic that validates compatible drive and load combinations before a work order is released to production.
- Overhead Chain Conveyor for Parts. FireFlight controls roller selection and bracket geometry, and guides updates across all dependent builds when engineering changes specs. A change to the bracket drawing updates every open work order referencing that bracket before any parts are cut.
- Accumulation Conveyor with Zero-Pressure Zones. Driven by parametric logic. The number of zones is entered at order creation, and drive rollers, photo-eyes, control modules, wiring harnesses, and zone sequencing hardware all scale from that single input, with no manual BOM calculation required.
- Spiral Lift Conveyor. Curved rollers, structural plates, specialized brackets, and weldments managed as nested fabrication templates. Each spiral stage is its own sub-template, so the weld shop receives a separate work order per stage while the assembly team sees the complete build sequence in correct dependency order.
- Modular Belt Washdown Conveyor. Stainless steel construction and washdown-rated components tracked as distinct material groups within the BOM. Sanitary hardware is flagged separately from standard hardware, preventing substitution errors that would create compliance and cleaning failures in food or pharmaceutical environments.
- Powered Roller Transfer Conveyor. High-torque drive rollers serialized and fully traceable through FireFlight's QA integration. Every motor assembly is linked to a QA record at the assembly stage. If a drive roller fails in the field, the serial number traces back to the production run, the incoming inspection record, and the installer.
- Telescoping Extendable Dock Conveyor. Template-driven subassemblies for each telescoping stage create predictable scheduling and a clear WIP structure. Each stage appears as a separate work order with its own material requirements and routing, removing the partial-build confusion that plagued the whiteboard schedule.
- Multi-Lane Merge Conveyor. Template logic enforces lane speed synchronization and matched roller types. Controller assignments are validated against lane configuration before the work order is released, so the old failure mode of mismatched controllers wired to the wrong lanes is blocked upstream at the template level.
- Gravity Roller Conveyor with Adjustable Stands. High-volume product benefitting from MRP forecasting and standard component reuse. Because this product uses a high proportion of shared components, inventory for this line stabilized quickly after MRP go-live, and standard components ordered here frequently satisfy demand from other product lines at the same time.
What changed after go-live?
Within a year of go-live, GlobalRoll's operation looked different from the outside and from the inside. On-time delivery rose. Emergency material runs dropped. The whiteboard schedule gave way to a production plan that reflected actual material availability and work-center capacity rather than optimistic assumptions that got overwritten by reality.
The cost picture that had been invisible for years became current. Product-line profitability was no longer estimated, it was measured. The products that had been absorbing rework, material substitutions, and engineering-change labor without those costs being captured were identified, and pricing moved from historical assumption to template-confirmed cost data.
- On-time delivery rose as production plans reflected real material availability instead of the whiteboard's optimistic assumptions.
- Inventory shortages at kitting dropped after MRP went live. The emergency material runs that had been a routine cost became rare enough to be notable.
- Engineering-controlled BOMs removed the manual reconstruction that every custom order used to need. Changes to shared components propagated automatically to all affected products and open work orders.
- QA tracking improved with component serialization. Field quality events that had required manual record searches were resolved from serialized data in minutes.
- Quoting became accurate and fast. Sales generated cost and lead time from template parameters without waiting on engineering to price each variation.
- Product-line profit became visible for the first time. Cost data that had been buried in handwritten labor records and scattered spreadsheets was captured and attributed to each product and each job.
Can you just ask the operation a question?
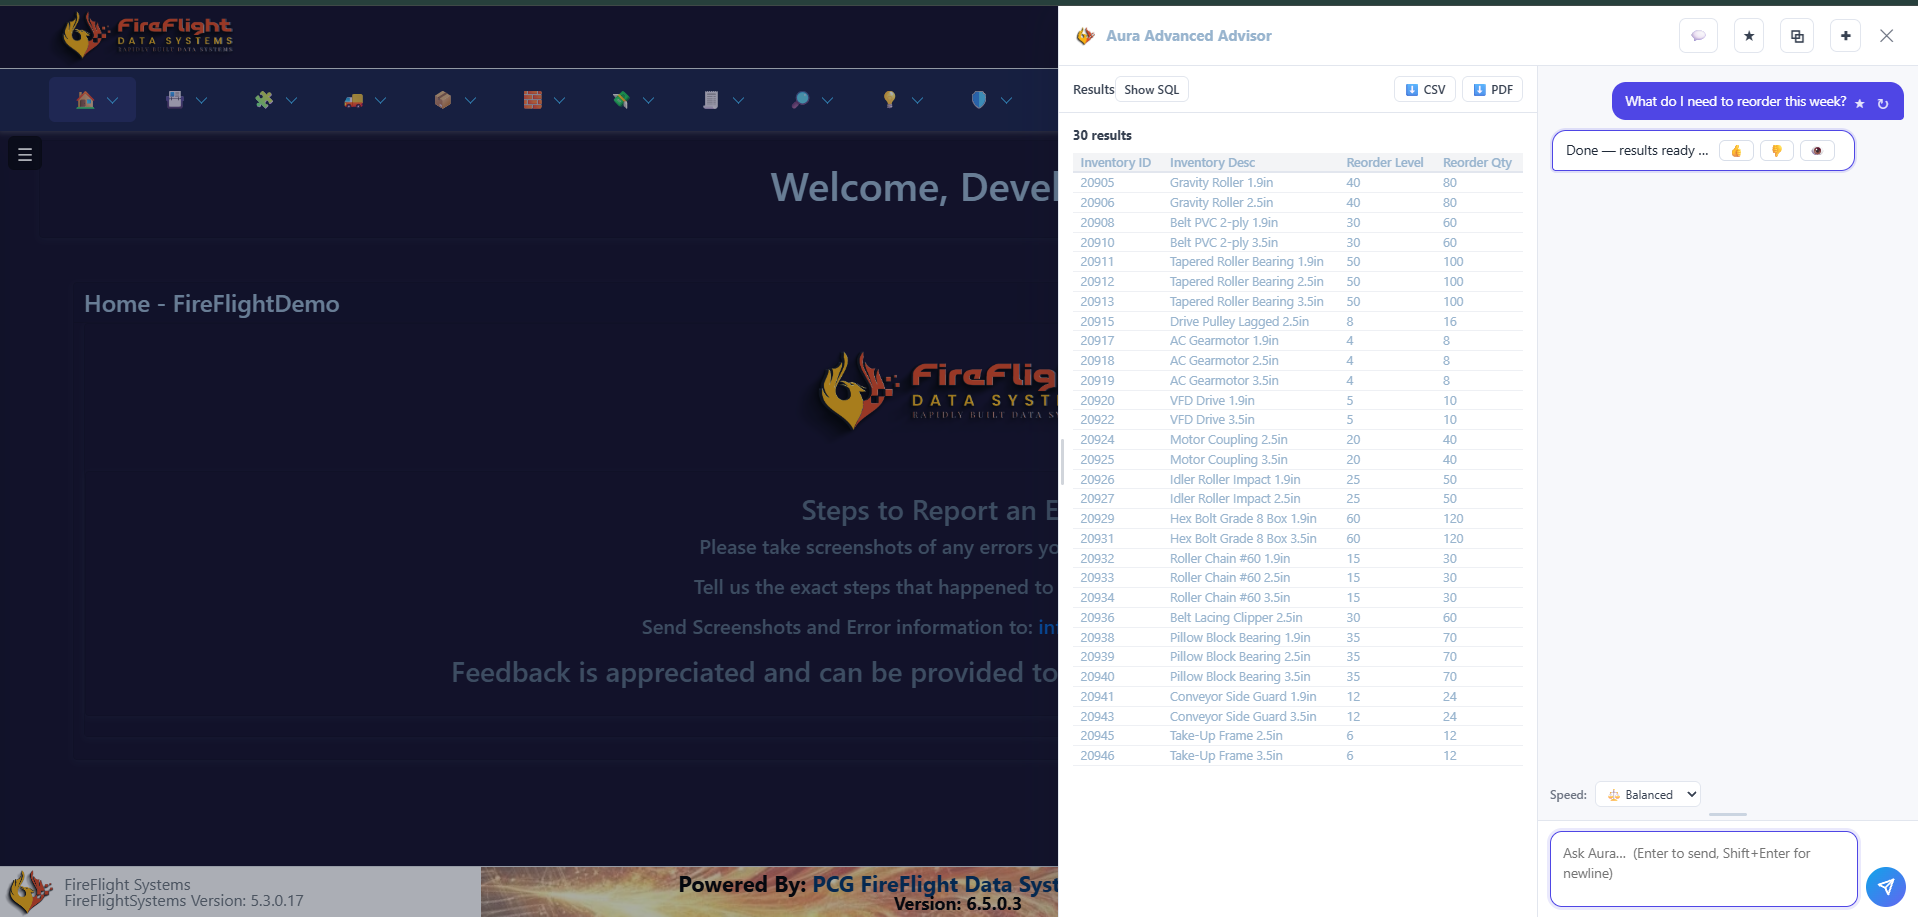
Yes. When the plant needs something specific, no one builds a report or exports a spreadsheet. You ask FireFlight in plain English and it returns the matching records, ready to export. The built-in advisor ships with every deployment, so the floor gets an answer without SQL or a report builder.
Answers from live data, in plain English
Type the question, get the records back. This is how the team pulls a reorder list or a QA history without leaving the system.
Every answer comes with Show SQL, CSV, and PDF export on the result.
Want to see FireFlight running on your kind of operation? Book a live demo and the team walks your BOMs, inventory, work orders, and job costing through the system, then maps what a deployment on your floor would look like.
Book a DemoWhat does this deployment teach other manufacturers?
Build-to-order manufacturing is the environment where product templates and component reuse pay off fastest. When the same drive assembly, roller set, or bracket configuration appears in multiple products, every engineering change that goes untracked in one product creates an inconsistency in all of them. GlobalRoll ran ten product lines with hundreds of shared components, so a change made once in FireFlight applied correctly across every product and open work order that depended on it.
The insight that carries to any build-to-order manufacturer: the whiteboard schedule is not a scheduling problem, it is a symptom of missing data. When material availability, work-center capacity, and WIP status are not current in a system, the schedule is a set of intentions that gets overwritten whenever reality arrives. GlobalRoll's scheduling whiplash did not come from bad planning. It came from planning against information that was already out of date before the day started. FireFlight did not change how GlobalRoll planned, it gave them accurate inputs so the plan could hold.
The second confirmed insight: costing visibility changes strategic decisions, not just operational ones. GlobalRoll was quoting all ten product lines without confirmed margin data per line. Once template-driven costing revealed actual labor and material consumption per product, some products were repriced, others were redesigned, and one was discontinued. None of those decisions could have been made correctly before the cost data existed. Deployments on this pattern complete in weeks, not months, and the template structure built for these ten lines applies directly to any manufacturer running configurable products across multiple work centers with shared components.
Is this your operation too?
This deployment fits a common pattern in US build-to-order manufacturing, roughly 20 to 500 employees, where configured products outgrew the tools that once tracked them. FireFlight is built and supported by Phoenix Consultants Group. The move tends to pay off when:
- You build configured or made-to-order products, and every order rebuilds a BOM by hand.
- A shared component changes, and the update never reaches every product that depends on it.
- Shortages surface at kitting rather than in planning, and rush orders keep rewriting the schedule.
- Profit by product line takes a manual scramble, and the data still lives in Access, FoxPro, or Excel.
FireFlight is developed and maintained exclusively by Phoenix Consultants Group. Since 1995, across 31 years, PCG has built and rescued more than 500 operational systems in over 45 industries, migrating Access, VB6, FoxPro, and Excel workflows onto modern .NET Core without stopping production. The same engineers who configure your plant keep supporting it as you grow.
Questions about a build-to-order deployment
Can FireFlight manage BOMs for build-to-order conveyor systems with frequent customer customizations?
How does FireFlight handle MRP for a multi-product operation with ten or more product lines?
Can FireFlight route work orders through multiple work centers in the correct sequence?
How does FireFlight support QA traceability with serialized components?
Can FireFlight calculate accurate job costs for custom conveyor builds in real time?
How does FireFlight handle engineering changes across products that share components?
How long does a FireFlight deployment take for an operation like GlobalRoll?
Every configured order rebuilt by hand is time and margin the plant cannot get back. FireFlight puts the BOM, inventory, routing, and job costing on one system, and PCG stands it up without stopping production. Most systems go live in weeks, not months.
Book a Demo
Allison Woolbert is the principal of Phoenix Consultants Group, the custom software consultancy founded in 1995. PCG has run legacy migration projects across Microsoft Access, Visual FoxPro, Paradox, VB6, and other discontinued platforms for industrial, manufacturing, and environmental services clients since the late 1990s. Allison leads PCG's discovery and architecture practice.
The company name in this case study has been changed to protect client information. The operation, configuration, and outcomes described are real. All system configurations are custom-built for each deployment, and implementation timelines, module availability, and integration scope vary by organization. FireFlight Data Systems is a product of Phoenix Consultants Group, founded 1995. Contact PCG directly to discuss requirements specific to your operation.
Airport IT Equipment Management: How TRD GSE Gave a Small IT Team Full Visibility Across Every Site

If your IT or operations team manages equipment across multiple sites and your current system requires a physical visit to know what is actually there, FireFlight was built for exactly this situation.
Schedule your free consultationWhat was the problem before FireFlight?
TRD GSE supports ground operations at airports across the country, providing the IT and communication infrastructure that airport teams depend on to do their jobs. Radios, routers, communication devices, portable power supplies, and support hardware distributed across numerous airport locations and remote sites. The equipment is not glamorous, but when a radio is missing or a router is not where the team expects it, airport ground operations feel it immediately.
The team responsible for managing this equipment was small. A small IT team covering a large multi-site operation has a fundamental resource mismatch: there are more locations than there are people who can physically check them. Before FireFlight, the only way to know what was at a given site was to go there or call someone there to look. Stock levels were confirmed through site visits and phone calls, not through a system. Equipment that moved between sites without a record being created simply disappeared from the visible inventory until it turned up somewhere or someone noticed it was gone.
The accountability gap compounded the tracking problem. When equipment went missing, there was no documented record of who had last checked it out or when. Resolving a missing item required conversations that could not be resolved by data, because the data did not exist. The IT team spent significant time on manual reconciliation, cross-site communications, and inventory chasing that should have been spent on the IT work itself. In 2026, an IT department that spends its capacity managing spreadsheets rather than infrastructure is not scaling. It is treading water.
Airport communication and support equipment is not optional inventory. A ground support operation where a radio cannot be located or a critical communication device is unavailable because nobody knows where it went is an operational safety concern, not just an inconvenience. For a company providing infrastructure support at airports, the expectation from airport operations teams is that the equipment will be there and working when it is needed. Spreadsheets cannot provide that assurance. FireFlight's real-time tracking and check-out accountability create a system that can.
What FireFlight was configured to handle
The deployment covered real-time inventory tracking for every piece of equipment across all airport sites, personnel check-out and return accountability per employee, live stock level monitoring per location, automated alerts for overdue or missing items, consolidated reporting across all sites for management, and maintenance and update scheduling for equipment requiring service. Configuration was completed in weeks, not months, and was designed to be manageable for a small IT team without a dedicated implementation resource.
Every piece of equipment tagged and logged with live updates as items move between sites or are checked out. Stock levels at each airport location visible in real time. No physical visit or phone call required to know what is where.
Employees check out and return equipment through FireFlight, creating a timestamped record of who has which item. Every check-out is attributed to a specific person. Disputes over missing equipment are resolved with the audit trail, not with conversations that have no documented record to reference.
Real-time stock levels at each airport location based on check-out activity, incoming transfers, and maintenance status. Shortages visible before someone at that site calls to report a missing item. Replenishment decisions made from current data, not from the last physical visit.
Items overdue for return or unaccounted for beyond a configured time window are flagged automatically. Management receives alerts before an unreturned item becomes a written-off loss. The record of who last had the item and when the check-out occurred gives management the information to act.
Management views inventory across all sites, utilization rates, lost or damaged item tracking, and allocation decisions from one dashboard. Consolidated data that previously required manual assembly from multiple site records is available in a single report at any time.
Equipment requiring maintenance, firmware updates, or testing scheduled and tracked within FireFlight. Items pulled from circulation for service marked as unavailable so they are not checked out in a non-operational state. Service records attached to each item when maintenance is complete.

What changed after deployment
The most immediate change was how the IT team spent its time. Before FireFlight, a significant portion of each day was consumed by manual reconciliation: checking spreadsheets, calling sites, cross-referencing which equipment had been sent where. After go-live, that work transferred to the system. Personnel at each site created the records by checking equipment in and out. The IT team reviewed the exceptions that FireFlight flagged rather than building the inventory picture from scratch each week.
The accountability shift changed how missing equipment situations were handled. When a radio or communication device went unaccounted for, FireFlight showed the last check-out record: who had it, when they took it, and from which location. That record converted a conversation about who might have the item into a documented fact about who did have it and when. The volume of those conversations dropped as personnel became aware that check-out records existed.
- Lost and misplaced equipment dropped significantly after every item was tagged and check-out records became the standard rather than an occasional practice. The accountability record changed behavior at the site level.
- Response times for replenishment and maintenance requests improved as the IT team worked from real-time stock data rather than from the last physical count at each site.
- Disputes over missing equipment were resolved with documentation rather than conversation. The check-out audit trail provided a factual record that replaced the uncertainty that had made those disputes unresolvable before.
- Equipment allocation across sites improved as the consolidated view revealed which locations were consistently overstocked and which were running short, allowing proactive redistribution rather than reactive emergency transfers.
- The IT team's capacity shifted toward strategic IT work as manual reconciliation, spreadsheet management, and cross-site communication overhead were absorbed by the system rather than by the team.
What we learned from this deployment
The resource mismatch in TRD GSE's operation is common to any small team responsible for a large multi-site footprint. The number of locations exceeds the number of people who can physically verify them. Without a system that makes inventory self-reporting through employee check-out activity, the team is perpetually behind: chasing the current state of inventory rather than managing it. FireFlight resolved this by shifting the data entry responsibility from the IT team to the people who actually move the equipment at each site.
The insight that applies to any small IT or operations team managing equipment across multiple sites: the check-out accountability record does more than track where equipment is. It changes behavior. When personnel at a site know that a check-out creates a timestamped record attributing the item to them, the informal practice of taking a radio or communication device without logging it changes. The accountability record is not primarily a compliance mechanism. It is an incentive structure that makes equipment tracking self-reinforcing rather than something the IT team has to enforce manually.
The second confirmed insight: consolidated reporting across sites is not primarily a management convenience. It is a decision-making input that does not exist without the consolidation. TRD GSE's IT team could not see which sites were consistently short of certain equipment types and which sites had surplus until FireFlight showed all of them at once. The reallocation decisions that followed, moving surplus from overstocked sites to understocked ones, could only happen after the consolidated picture existed. Before FireFlight, the picture existed in pieces that nobody had assembled.
Deployments for multi-site IT equipment management covering asset tracking, check-out accountability, stock level monitoring, and consolidated reporting are completed in weeks, not months. The configuration built for TRD GSE applies directly to any operation where a small team is responsible for equipment distributed across more locations than the team can physically monitor.
Frequently asked questions
Can FireFlight track individual pieces of IT equipment across multiple airport locations simultaneously?
How does FireFlight create accountability for equipment checked out by specific personnel?
Can FireFlight alert management when equipment is not returned or goes missing?
How does FireFlight help a small IT team manage inventory across a large multi-site operation?
Can FireFlight monitor stock levels at each airport site without requiring a physical inventory check?
How does FireFlight handle maintenance scheduling for airport communication and support equipment?
How long does a FireFlight deployment take for a multi-site airport operations support company?
The company name in this use case has been changed to protect client information. The operational scenario and outcomes described represent a documented FireFlight deployment.