Project Reports | FireFlight
Last updated: April 2026

Project Reports: Financial Performance and Status Across Every Active Project

Budget versus actual, cost-to-complete, phase-level status, and financial performance by project type. All pulling from the same live records your project and finance teams update daily.

FireFlight Project Reports give project managers and finance teams a live view of every active project's financial position. Budget versus actual spend, cost-to-complete estimates, and phase-level status all read from the same work order, time tracking, and procurement records that teams update through their normal workflows. No separate reporting database to maintain. No period-end export required.
FireFlight Project Reports showing financial performance and status across active project portfolio

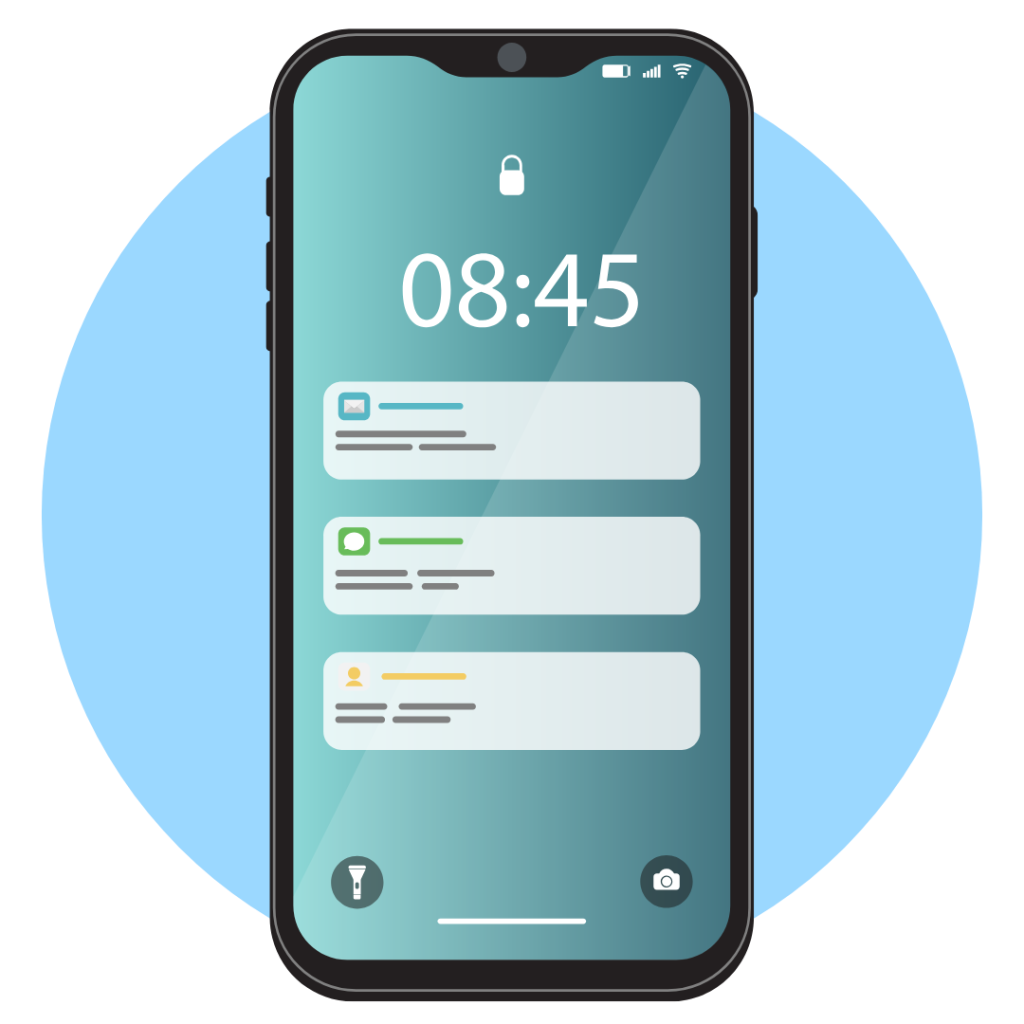
In 2026, project-driven operations that are still assembling financial status from spreadsheets and email updates are making budget decisions on data that is days or weeks old by the time it reaches the person who needs it. FireFlight Project Reports replace that cycle by reading from live transaction data. The numbers a project manager sees on a Tuesday morning reflect what happened on Monday afternoon, not what was manually entered during last Friday's status update.

Schedule your free consultation

What does the Project Financial Dashboard show?

The Project Financial Dashboard shows budget versus actual spend, cost-to-complete estimates, and financial performance by project or project category. Data pulls from active work orders, time tracking entries, and procurement records as transactions are posted. Finance teams and project managers see the same numbers at the same time without anyone having to reconcile two different views of the same project at the end of the month.

For operations running multiple concurrent projects, the dashboard also shows portfolio-level performance. A manager overseeing ten active projects can see which ones are tracking to budget, which ones are running over, and where cost-to-complete estimates have shifted since the last review. That comparison happens without pulling separate reports for each project and trying to read them side by side.

PCG has built project financial reporting for operations across manufacturing, industrial services, and compliance-driven environments since 1995. The consistent failure point is the same across all of them: project financial data is available somewhere in the organization, but it is not available in one place at the moment the decision needs to be made. The Project Financial Dashboard is the fix for that specific problem.

How do project templates connect to reporting in FireFlight?

When a project is built from a reusable template in FireFlight, the cost codes, phase structure, and reporting categories defined in the template carry through to the project record automatically. Reports built against that project use the same structure every time, which means a finance team reviewing project performance across the portfolio is comparing consistent categories rather than trying to reconcile reports that were structured differently for each project.

For operations running recurring project types, this consistency compounds over time. The tenth project of the same type has financial history that is directly comparable to the first nine because the reporting structure never changed between them. Estimating accuracy improves. Budget variance analysis becomes meaningful rather than approximate.

FireFlight project reporting showing phase-level status and budget variance across active projects

Project reports in FireFlight are not a separate layer built on top of the project data. They read directly from the work orders, time entries, purchase orders, and cost postings that the project team creates through normal daily work. The report is current because the underlying records are current, not because someone ran an export and loaded it into a reporting tool.

PCG configures project report structures, cost codes, and financial dashboard parameters for your specific operation during deployment. Most operations have project reporting fully operational in weeks, not months.

What breaks down when project financial reporting lives in spreadsheets: Each project manager maintains their own version of the budget. Finance maintains a separate view. The two reconcile at month end, by which point the decisions that needed the data have already been made on estimates rather than facts. Projects run over budget not because the overrun was invisible, but because it was not visible to the right person at the right time.

FireFlight Project Reports make project financial data visible to project managers and finance teams simultaneously, from the same source, without a reconciliation step between them. PCG has been building project management and financial reporting systems for over 30 years. The organizations that get the most out of live project reporting are not the ones with the most complex projects. They are the ones that previously had the data somewhere but could never get it to the decision-maker before the decision was already made.

Ikhana on-screen guide
Meet Ikhana

Your Personal Guide on Every Page

From the first click to the final step, Ikhana, your on-screen tutor, shows you how it all works. Every field, every button, every page explained with clarity, right where you need it.

In FireFlight Project Reports, Ikhana guides project managers and finance staff through dashboard navigation, report configuration, and cost code interpretation. Teams that are new to structured project financial reporting get up to speed in days rather than requiring a dedicated training engagement.

Learn more about Ikhana

What does live project reporting actually change for an operation?

  • Budget decisions are made on current data: Project financial status reflects transactions posted today, not a spreadsheet updated last Friday. Project managers and finance teams see the same numbers at the same time without waiting for a reporting cycle to close.
  • Cost overruns are visible before they become unrecoverable: Budget versus actual tracking at the phase level means a cost variance shows up when it is still addressable, not when the project is already over budget and the only question left is by how much.
  • Portfolio visibility without assembling individual reports: Operations running multiple concurrent projects see summary financial performance across the portfolio from a single view. Identifying which projects need attention does not require opening each project record separately.
  • Consistent reporting across recurring project types: Projects built from the same template report against the same cost code structure. Historical financial data across similar projects becomes directly comparable, which improves estimating accuracy for every project that follows.
  • Client and stakeholder reporting without manual assembly: Custom report outputs pull from the same live project data that internal teams use. A client-facing project status report reflects current actuals rather than what was manually compiled for the last status meeting.

What PCG learned building project reporting systems across 31 years: The reporting gap that costs project-driven operations the most is not the gap between what happened and what was recorded. It is the gap between what was recorded and when the right person saw it.

FireFlight Project Reports close that gap by making project financial data available in real time to everyone who needs it, from the first transaction posted against the project through final close-out. The data is not assembled at the end of the period. It accumulates continuously and is always current. PCG configures report structures for your specific project types during deployment, and most operations are running live project financial reports in weeks, not months after go-live.


Questions about FireFlight Project Reports

What does the Project Financial Dashboard show in FireFlight?
+
The Project Financial Dashboard shows budget versus actual spend, cost-to-complete estimates, and financial performance by project or project category. Data pulls from active work orders, time tracking, and procurement records in real time. Finance teams and project managers see the same numbers without reconciling separate systems.
How do project reports connect to templates and planning in FireFlight?
+
Project reports in FireFlight read from the same records that project templates, work orders, and resource plans populate during execution. When a project is built from a reusable template, the reporting structure inherits the same categories and cost codes defined in the template. Reports are consistent across projects without manual configuration for each one.
Can project reports be configured for different industries or project types?
+
Yes. PCG configures project report structures for your specific operation during deployment. The categories, cost codes, and reporting dimensions that appear in FireFlight project reports reflect your actual project types rather than a generic template. Operations running multiple project types can have separate report configurations for each.
How does FireFlight project reporting handle multi-phase or long-running projects?
+
FireFlight tracks project financials and status at the phase level as well as the project level. Long-running projects with distinct phases show budget, spend, and completion status per phase rather than only at the top-level summary. Project managers can see where a project stands at any point in its lifecycle without waiting for a period-end report.
Who uses project reports in FireFlight and for what decisions?
+
Project managers use reports to track scope, schedule, and cost performance against the original plan. Finance teams use project financial reports for budget reviews and billing. Operations leaders use summary views to compare performance across the active project portfolio. All three roles read from the same underlying project data.
How long does it take to set up project reporting in FireFlight?
+
Project reporting is configured as part of the broader FireFlight deployment. PCG sets up report structures, cost codes, and financial dashboard parameters during the initial configuration. Most operations have project reporting fully operational in weeks, not months. Reports are available from the first project entered into the system.
Can FireFlight project reports be exported or shared outside the system?
+
Yes. Custom Reporting in FireFlight produces formatted outputs that can be shared with clients, finance teams, or executive stakeholders. Ad-hoc reports can be run and exported on demand. PCG configures the report formats and export options for your specific use cases during deployment.

Project financial data that reaches the decision-maker a week after the decision was made is not reporting. FireFlight Project Reports make budget versus actual, cost-to-complete, and phase-level status available in real time to every role that needs it. PCG configures the report structures for your specific project types. Most operations are running live project financial reports in weeks, not months.

Schedule your free consultation

Allison Woolbert
Allison Woolbert
Principal, Phoenix Consultants Group  |  Developer, FireFlight Data Systems

PCG founded 1995. 500+ applications built across 31 years, roughly one-third in regulated environments where software failure carries direct operational and compliance consequences. FireFlight is the platform built from that body of work. When you contact PCG, Allison is the person who answers.

phxconsultants.com LinkedIn

FireFlight Data Systems is a product of Phoenix Consultants Group. PCG founded 1995. All system configurations are custom-built for each deployment. Implementation timelines, module availability, and integration scope vary by organization. Contact PCG directly to discuss requirements specific to your operation.

Project Reports

Build configurable project templates that reflect your workflows, structures, and resource plans. Save time and maintain consistency across teams.

Financial Reports | FireFlight Data Systems
Last updated: April 2026

Financial Reports: Eight Dashboards, One Live Data Source

Cash flow forecasting, asset lifecycle metrics, debt management, operational efficiency, credit risk, scenario modeling, and executive KPIs: all pulling from connected FireFlight systems, all updated automatically.

FireFlight's financial reporting suite covers eight dashboards built for different financial leadership questions. In 2026, environmental and industrial firms managing compliance project finance alongside operational overhead need more than a monthly P and L. They need current visibility into cash runway, credit risk, loan obligations, project economics, and executive KPIs: each answered by a dedicated dashboard, each drawing from the same live data source.
FireFlight Financial Reports: eight dashboards covering the full financial picture from cash flow to strategic KPIs

A financial reporting suite that requires separate report requests and separate data exports for each question is a suite that slows down every decision that depends on it. All eight dashboards below pull from the same connected FireFlight financial data and update automatically when underlying records change.

Schedule your free consultation

The eight financial dashboards

Cash Flow
Cash Flow Health and Forecast
Cash Runway, Cash Flow Adequacy Ratio, and a Rolling 13-Week Forecast built from actual scheduled transactions. Surfaces tight cash flow weeks before they arrive. Includes Average Revenue per Customer and Top 10 Customers by Revenue for revenue context.
5 live indicators
Asset Finance
Financial and Lifecycle Metrics
Capitalization Log tracking every capital asset from acquisition through depreciation to disposal. Built for finance, operations, and compliance teams simultaneously. Fixed infrastructure and movable equipment in one live view.
Capitalization Log + lifecycle metrics
Debt Management
Loan Allocations
Total outstanding loan balances, interest exposure, aggregate monthly payment obligations, and a forward-looking Loan Maturity Schedule across the full debt portfolio. Replaces manual reconciliation across individual lender portals.
5 live indicators
Operations
Operational Efficiency Reports
Revenue per Employee, Project Overrun Report, Operational Cycle Time Metrics, Operational Cycle Time Report, and Cost-to-Serve Report. Identifies where work is slowing down and where project economics are drifting before either shows up in the financials.
5 live reports
CFO View
Quick-View CFO Indicators
18 live indicators covering cash position, 7-day forward cash flow, net profit, receivables health, credit utilization, revenue concentration, regulatory countdown, and daily payout summary. One screen before every significant financial decision.
18 live indicators
Risk
Risk and Early Warning Reports
Client Credit Risk Watchlist, Company Credit Risk Watchlist, and Expense Spike Alerts from live data. Surfaces behavioral risk signals before they become collection problems or budget overruns. Thresholds configured to your specific client base and cost structure.
3 live watchlists
Scenario Modeling
Scenario and Sensitivity Analysis
Best-case and worst-case cash flow projections built on live operational data. Sensitivity variables configured to your actual cost drivers. KPIs, status indicators, and exception flags alongside the scenario projections on the same screen.
Live scenario projections
Executive
Strategic KPI Executive Dashboard
Current Ratio, Quick Ratio, and Debt-to-Equity Ratio from live financial data, alongside the KPIs configured for your operation. One view for leadership decisions without switching between systems or waiting for a report cycle.
Live financial ratios and KPIs

Which dashboard answers which financial question?

The eight dashboards are organized by the financial question they answer rather than by the data they contain. Cash Runway and the 13-Week Forecast answer: how long can we operate at the current expense rate, and what does cash flow look like across the next quarter. The CFO Quick-View answers: what is the current financial position across 18 indicators before this decision. Risk and Early Warning answers: which client relationships are showing behavioral signals that precede collection problems, and which expense lines have spiked.

The Operational Efficiency Reports answer the question that the purely financial dashboards do not address directly: where is the operation losing money at the project level, and why. The Project Overrun Report and Cost-to-Serve analysis work at the project economics level rather than the portfolio level, which is where the decisions that affect profitability actually happen. By the time an operational efficiency problem appears in the financial dashboards, it has already had time to accumulate. The Operational Efficiency suite catches it earlier.

Scenario and Sensitivity Analysis and the Strategic KPI Executive Dashboard work at the planning and governance level. Scenario analysis answers: what are the financial outcomes under different conditions, and which variables drive the largest changes. The Strategic KPI dashboard answers: where do the key financial ratios stand right now, and has anything moved since the last time leadership checked. Both are most relevant before significant decisions rather than as daily operational tools.

What PCG has learned across 31 years of financial reporting software implementations

The most consistent finding across three decades of building financial systems for project-based and compliance-driven operations: the financial reporting suite that gets used is the one where each dashboard answers a specific question that a specific person has before a specific decision. Generic financial dashboards that try to serve every user with the same view produce high adoption at deployment and declining use within six months, because no individual user finds the view precisely useful for their decision-making context.

PCG builds the eight dashboards in this suite as distinct tools for distinct purposes rather than as variations on the same general financial view. The CFO daily check and the scenario analysis for a capital decision serve different purposes and different decision timelines. The risk early warning view and the loan maturity schedule address different financial risks on different timeframes. The configuration work during deployment is largely about matching each dashboard to the specific decision context of the people who will use it, not about displaying every available financial metric to everyone simultaneously.


Frequently Asked Questions

FireFlight What financial reports and dashboards does FireFlight include? +
FireFlight's financial reporting suite includes eight dashboards: Cash Flow Health and Forecast, Financial and Lifecycle Metrics, Loan Allocations, Operational Efficiency Reports, Quick-View CFO Indicators, Risk and Early Warning Reports, Scenario and Sensitivity Analysis, and Strategic KPI Executive Dashboard. Each pulls from live FireFlight data and updates automatically.
FireFlight Which financial dashboard should a CFO check first each day? +
The Quick-View CFO Indicators Dashboard and the Cash Flow Health and Forecast Dashboard are the two most relevant for daily financial leadership decisions. The CFO dashboard surfaces current liquidity, debt ratios, and over-budget project alerts across 18 live indicators. The Cash Flow dashboard adds the Rolling 13-Week Forecast alongside Cash Runway and Cash Flow Adequacy Ratio. Both pull from live data and require no report request to access.
FireFlight What is the difference between the Scenario Analysis Dashboard and the Strategic KPI Dashboard? +
The Scenario and Sensitivity Analysis Dashboard models best-case and worst-case cash flow outcomes under different operational assumptions, configured for your specific cost drivers. The Strategic KPI Executive Dashboard tracks fixed financial ratios and performance indicators: Current Ratio, Quick Ratio, Debt-to-Equity, and configured operational KPIs. Scenario analysis is forward-looking and conditional. The KPI dashboard is current and factual.
FireFlight Which dashboard surfaces credit and collection risk before it becomes a problem? +
The Risk and Early Warning Reports Dashboard monitors Client Credit Risk, Company Credit Risk, and Expense Spike Alerts from live data. It surfaces behavioral signals that precede collection problems. The Operational Efficiency Reports Dashboard complements this with the Project Overrun Report and Cost-to-Serve analysis, which identify where project economics are drifting before they affect the income statement.
FireFlight Can all eight dashboards connect to the same financial data source? +
Yes. All eight dashboards pull from connected FireFlight financial systems and the ERP integration. Each draws from the same underlying live data rather than from separate feeds. When a transaction posts, every dashboard that references that data reflects the change. Finance teams working across multiple dashboards are always working from the same current financial picture.
FireFlight How long does it take to configure and deploy these dashboards? +
PCG configures FireFlight dashboards in weeks, not months. Individual dashboards typically deploy in 6 to 10 weeks. Deploying the full financial reporting suite together can be scoped as a single engagement. Contact PCG to discuss which dashboards are the highest priority for your operation and what the deployment sequence looks like.

If your financial reporting currently requires separate report requests, separate exports, and separate reconciliation steps for each question leadership has before a decision, the problem is not the questions. It is the architecture. FireFlight's financial reporting suite answers eight distinct questions from one live data source. PCG deploys in weeks, not months, and Allison takes every call personally.

Schedule your free consultation

Allison Woolbert
Allison Woolbert
Principal, Phoenix Consultants Group  |  Developer, FireFlight Data Systems

PCG founded 1995. 500+ applications built across 31 years, roughly one-third in regulated environments where software failure carries direct operational and compliance consequences. FireFlight is the platform built from that body of work. When you contact PCG, Allison is the person who answers.

phxconsultants.com LinkedIn

FireFlight Data Systems is a product of Phoenix Consultants Group. PCG founded 1995. All system configurations are custom-built for each deployment. Implementation timelines, module availability, and integration scope vary by organization. Contact PCG directly to discuss requirements specific to your operation.

Financial Reports

Move seamlessly from estimation to invoicing and reconciliation. Centralized tools help you quote accurately, invoice promptly, and track payments effortlessly.

Inventory Reports | FireFlight
Last updated: April 2026

Inventory Reports

30 reports covering every layer of inventory: stock levels, movement history, supplier performance, reorder status, valuation, work order aging, and dead stock. All live. No exports required.

FireFlight's inventory reporting suite gives operations managers a complete picture of what is on hand, what is moving, what has stopped moving, and what needs to be ordered across every location in your system. Thirty reports run directly against live data. Most operations are up and running in weeks, not months.
FireFlight inventory reports dashboard showing live stock movement and on-hand data

If your inventory team is pulling stock reports from three different places and reconciling them manually, the problem is not the data. The data exists. The problem is that it is not connected. FireFlight's 30 inventory reports run from a single data source the same records that drive receiving, work orders, and purchasing so the numbers match without anyone having to make them match.

Schedule your free consultation

What does 30 inventory reports actually cover that a standard system doesn't?

Most inventory platforms give you on-hand quantity and maybe a movement log. What they do not give you is the analysis layer: which items have not moved in 90 days while stock sits on the shelf, which storage rows exist in your system with no inventory mapped to them, which items appear under two different barcodes because someone entered them twice. FireFlight's reporting suite was built to surface exactly those operational gaps because those are the gaps that cost money without anyone noticing.

The Duplicate Barcodes and SKUs report alone has corrected data integrity issues in operations that had been running for years with quietly inflated on-hand counts. The Orphan Storage Rows report finds storage locations that exist in the system but have no inventory assigned which matters the moment you try to count or audit. These are not edge cases. In operations that have grown over time, they are normal accumulation, and the only way to find them is a report designed to look.

Centralized inventory view in FireFlight showing stock across multiple locations and categories

The Regional Stock Imbalance report is where multi-location operations find money they did not know they had tied up. It compares maximum and minimum on-hand quantities per item across sites, surfacing situations where one facility has overstocked while another has dropped below reorder threshold. Rebalancing between locations costs far less than placing a new purchase order, but most operations only discover the imbalance after the order is already placed.

Inventory Aging by Lifecycle Status adds a time dimension that standard on-hand reports leave out entirely. Items do not just sit they age through procurement stages, and the cost of carrying them changes depending on where they are in that cycle. For operations managing capital-intensive inventory, this report is the difference between knowing what you have and knowing what your inventory is actually worth at any given moment.

How do reorder and replenishment reports work across multiple locations?

The Items to Reorder and Order report compares current on-hand quantities against defined reorder points for every item at every location simultaneously. When an item drops below its threshold at a specific site, it appears in the report with the location, the current quantity, and the reorder point it crossed. Procurement does not need to check each site separately or maintain a separate reorder spreadsheet.

On-Hand vs. Reorder takes that a step further by showing the replenishment gap in quantified terms. Not just which items are below threshold, but by how much, and at which sites. For operations with vendor lead times that vary by supplier, having the replenishment gap visible before the shortage occurs is what keeps work orders from stalling. The report works in conjunction with the Vendor Lead Time KPI, so the same team member reviewing reorder status can see whether the relevant supplier has been consistently hitting their stated lead time or not.

Every report pulls from the same live transaction records. There is no separate reporting database that needs to be synced, no nightly batch job, and no window during which the numbers in a report are behind what is actually on the shelf. A receipt logged at 2pm appears in the On-Hand Inventory report at 2pm.

PCG has been building inventory management systems since 1995. The 30-report suite in FireFlight reflects what operations managers across manufacturing, fleet, industrial, and service environments have actually needed to run their inventory well not what a product manager assumed they needed.

What does supplier performance reporting look like beyond order history?

Three reports in FireFlight address supplier performance from different angles. The Supplier Performance Scorecards report measures vendor fill rate, on-time delivery, and lead time consistency over a configurable period. Vendor Lead Time KPI tracks whether a supplier's actual delivery window matches what they quoted at the time of the order. Vendor Spend Summary aggregates total order value per supplier over a defined period, which is the data needed to support volume negotiations.

When all three are running from the same data set, a procurement manager can walk into a supplier review with verified performance numbers rather than anecdotes. The supplier who always seems reliable looks different when the data shows a 23% late delivery rate over the past six months. That conversation changes, and so do the contracts that come out of it. Most operations currently have some version of this data scattered across emails, spreadsheets, and a receiving log that nobody fully trusts. FireFlight puts it in one place and makes it verifiable.

Ikhana on-screen guide
Meet Ikhana

Your Personal Guide on Every Page

From the first click to the final step, Ikhana, your on-screen tutor, shows you how it all works. Every field, every button, every page explained with clarity, right where you need it.

On the inventory reports pages, Ikhana walks through filter configuration, date range logic, and how to read classification and aging outputs. With 30 reports available, knowing which one answers your specific question matters more than knowing all 30.

Learn more about Ikhana

The full inventory report library

  • FireFlight ABC Classification. Segments inventory into value tiers based on consumption. A items get the most management attention; C items reveal where capital is parked with minimal operational return. Drives reorder priority and cycle count frequency.
  • FireFlight Dead/Slow Stock (No Usage in Period, On-Hand > 0). Identifies items with no recorded consumption during a defined period while stock still exists. The starting point for any inventory reduction or write-down process.
  • FireFlight Duplicate Barcodes/SKUs. Finds items entered more than once under different identifiers. Correcting duplicates before they accumulate is what keeps on-hand counts accurate and physical counts from producing unexplainable variances.
  • FireFlight Fast-Moving Items (by Usage Qty in Period). Ranks items by consumption volume over a selected period. Used for storage placement decisions, safety stock reviews, and identifying which items carry the most operational risk if they go out of stock.
  • FireFlight Image/PDF/Video Coverage (Content Audit). Audits which inventory items have supporting documentation attached and which do not. For operations where item-level documentation affects compliance or training, this report identifies the gaps before an audit does.
  • FireFlight Inventory Aging by Lifecycle. Tracks how long items have been in each procurement stage. Identifies where inventory is sitting longer than expected in receiving, staging, or active storage, with cost-of-carry implications that standard on-hand reports do not show.
  • FireFlight Inventory Backorder. Lists items currently on backorder with the originating work orders or requests that triggered them. Operations managers can prioritize fulfillment and communicate delays to the affected teams without hunting through individual records.
  • FireFlight Inventory Turnover. Calculates how many times inventory cycles through in a period. Low turnover on high-value items flags carrying cost problems. High turnover on critical items flags reorder risk. Both matter and neither shows up in a simple on-hand count.
  • FireFlight Inventory Usage Log (Consumptions). A full audit trail of every item consumed, by whom, for what purpose, and from which location. Supports compliance documentation, cost allocation, and any investigation into unexplained stock reductions.
  • FireFlight Items to Reorder and Order. Compares current on-hand quantities against reorder thresholds across all locations. Items that have crossed their reorder point appear automatically, filtered by site, so procurement acts before a stockout is already in progress.
  • FireFlight Items Report. A full catalog view of all active inventory items with current attributes, classifications, storage assignments, and linked supplier records. The baseline reference report for any inventory audit or master data cleanup project.
  • FireFlight Items Without Any Storage (Not Stored Anywhere). Identifies items in the system with no assigned storage location. These are the items that will be missing from a physical count because there is no bin or shelf to look in. Finding them before an audit is considerably less disruptive than finding them during one.
  • FireFlight Items Without Any Vendor Mapping. Surfaces items with no supplier record attached. When a reorder is triggered for one of these items, procurement has no vendor to contact. This report makes the gap visible before the shortage makes it urgent.
  • FireFlight Last Movement Per Item (Most Recent History). Shows the most recent transaction date for every item in the system. Combines with the Dead/Slow Stock report to confirm whether an item has genuinely gone unused or was simply miscategorized in a previous report run.
  • FireFlight Movement Volume by Region/Station (Period). Aggregates transaction volume by physical location over a selected period. Identifies which stations or regions are driving the most inventory activity and which are underutilized relative to the stock assigned to them.
  • FireFlight On-Hand Inventory. Current stock quantities by item, location, and category. The foundational real-time view that every other inventory report builds on. Filters to a single site or shows the consolidated total across the full operation.
  • FireFlight On-Hand vs. Reorder (Replenishment). Compares current stock levels against defined reorder points and shows the replenishment gap in quantified terms. Used alongside vendor lead time data to time purchase orders before a shortage affects operations.
  • FireFlight Open Work Order Aging Buckets. Groups open work orders by elapsed time since creation. Long-aging work orders that have not been closed are often tied to inventory holds or parts delays that are not visible anywhere else in the system until this report surfaces them.
  • FireFlight Orphan Storage Rows (No Matching Inventory). Finds storage locations that exist in the system but have no inventory mapped to them. Critical for audit preparation and for operations that have reorganized physical storage without updating the system to match.
  • FireFlight Regional Stock Imbalance (Max-Min On-Hand per Item). Compares on-hand quantity highs and lows per item across all sites. Identifies where rebalancing between locations is more cost-effective than placing a new purchase order.
  • FireFlight Storage Movement History (Check-in/out trail). A full audit log of every item movement between storage locations, including who performed the movement and when. Supports both compliance documentation and the investigation of physical count discrepancies.
  • FireFlight Supplier Performance Scorecards. Measures vendor fill rate, on-time delivery, and lead time consistency over a configurable period. Gives procurement teams verified performance data for contract reviews and supplier negotiations.
  • FireFlight Top Users by Consumption (Period). Ranks individuals or teams by inventory consumption volume over a selected period. Useful for cost allocation, identifying unusual usage patterns, and supporting any investigation into unexplained stock reductions.
  • FireFlight Usage by Purpose (Period). Breaks consumption down by the stated purpose behind each transaction maintenance, production, project, or other categories defined by the operation. Supports cost center reporting and budget variance analysis at the item level.
  • FireFlight Valuation by Lifecycle Status. Calculates inventory value segmented by where each item sits in its lifecycle. Gives finance teams the data they need for period-end reporting without a manual reconciliation between the inventory system and the accounting platform.
  • FireFlight Vendor Catalog and Last Order. Shows the full supplier catalog for each vendor alongside the date and quantity of the most recent order placed. Useful for consolidating purchasing decisions and for identifying suppliers that have not been used recently despite having active catalog agreements.
  • FireFlight Vendor Lead Time KPI. Tracks whether each supplier's actual delivery window matches their quoted lead time. Discrepancies between promised and actual lead times show up here before they turn into reorder calculation errors that cause stockouts.
  • FireFlight Vendor Spend Summary (Orders). Aggregates total purchase order value per supplier over a defined period. The data foundation for volume discount negotiations and for identifying where spend is concentrated across the supplier base.
  • FireFlight Work Order Turnaround (Closed Only). Measures elapsed time between work order creation and closure for completed orders. Identifies where fulfilment takes longer than expected, whether the delay is in parts availability, labor, or approval.
  • FireFlight Zero On-Hand Items with Open Work Orders. The report that prevents operational surprises. Finds items currently at zero on-hand quantity that have active work orders waiting on them. These are the stockouts that have already happened but have not yet caused a visible operational failure.

What PCG learned across 31 years of inventory system builds: the reports that get run every day are the ones that take less than 60 seconds to produce and answer a question someone was going to ask anyway. The reports that sit unused are the ones that require setup each time or deliver more context than the person running them has time to process.

Every report in this library was designed around the question an operations manager, procurement lead, or warehouse supervisor is already asking. If the answer required more than a few clicks and a filter selection, the report was redesigned until it did not.

What operations see after deployment

  • FireFlight Physical counts produce fewer surprises. Orphan storage rows, items without storage assignments, and duplicate SKUs are identified and corrected before count day rather than during it, which means variances that do appear are real discrepancies rather than data artifacts.
  • FireFlight Procurement stops reacting and starts anticipating. Reorder reports, vendor lead time data, and regional imbalance visibility combine to give purchasing teams enough lead time to act before a stockout is already affecting work orders.
  • FireFlight Capital tied up in dead stock becomes visible and addressable. The Dead/Slow Stock and Inventory Aging reports give finance and operations a shared view of where inventory value is sitting idle, which changes the conversation about what to carry and what to reduce.
  • FireFlight Supplier reviews are grounded in verified data. Scorecard, lead time, and spend reports replace the account relationship as the basis for vendor conversations, which produces better contract terms and more reliable delivery commitments.

Questions operations teams ask before deploying inventory reporting

FireFlight How many inventory reports does FireFlight include?
+
FireFlight includes 30 inventory reports covering stock levels, movement history, supplier performance, reorder status, valuation, work order aging, and more. All reports run against live data with no export or scheduled refresh required.
FireFlight What is the ABC Classification report in FireFlight?
+
The ABC Classification report segments your inventory into tiers based on consumption value: A items are your highest-value movers, C items are low-value and slow. This classification drives reorder prioritization, storage placement decisions, and cycle count frequency without manual analysis.
FireFlight How does FireFlight identify dead stock and slow-moving inventory?
+
The Dead and Slow Stock report filters for items with no recorded usage within a defined period while on-hand quantity is greater than zero. You set the period. The report flags items that are consuming storage and capital without contributing to operations, which is the starting point for any inventory reduction effort.
FireFlight Can FireFlight identify items that need to be reordered across multiple locations?
+
Yes. The Items to Reorder and Order report compares current on-hand quantities against defined reorder points across every location in your system. Items that have dropped below threshold appear automatically, filtered by site if needed, so procurement can act before a stockout occurs.
FireFlight What does the Regional Stock Imbalance report show?
+
The Regional Stock Imbalance report compares maximum and minimum on-hand quantities for each item across sites. It surfaces situations where one location is overstocked on an item while another location is running short, which allows operations to rebalance before placing a new purchase order.
FireFlight Does FireFlight track supplier performance beyond just order history?
+
Yes. The Supplier Performance Scorecards report measures vendor fill rate, on-time delivery, and lead time consistency over a defined period. Combined with the Vendor Lead Time KPI and Vendor Spend Summary reports, procurement teams have the data to evaluate suppliers on actual performance rather than account rep relationships.
FireFlight How long does it take to deploy FireFlight inventory reporting for my operation?
+
Most operations are running live inventory reports in weeks, not months. PCG handles configuration, data migration, and training. The timeline depends on the number of locations, item categories, and integrations involved. There is no rebuild of your existing processes from scratch.

Thirty reports. Live data. No exports. If your current inventory system requires manual work to answer basic questions about what is on hand, what is moving, and what needs to be ordered, FireFlight is built specifically to remove that manual layer. Setup takes weeks, not months, and PCG handles the configuration.

Schedule your free consultation

Allison Woolbert
Allison Woolbert
Principal, Phoenix Consultants Group  |  Developer, FireFlight Data Systems

PCG founded 1995. 500+ applications built across 31 years, roughly one-third in regulated environments where software failure carries direct operational and compliance consequences. FireFlight is the platform built from that body of work. When you contact PCG, Allison is the person who answers.

phxconsultants.com LinkedIn

FireFlight Data Systems is a product of Phoenix Consultants Group. PCG founded 1995. All system configurations are custom-built for each deployment. Implementation timelines, module availability, and integration scope vary by organization. Contact PCG directly to discuss requirements specific to your operation.

Master Every Stock Movement

Whether you manage one location or dozens, this workspace centralizes all inventory activity. Define stock levels, monitor movements, and enforce control with powerful reporting and flexible tracking structures that adapt to your business.
Built for operational resilience, scalable across sites.

Inventory Reports

Map every bin, shelf, and warehouse with precision. Maintain clean, searchable inventory records across all storage zones — and stay audit-ready at all times.

Work Orders Reports

Work Orders

  • Integration Blocks
  • Mainnance Usage
  • Open Work Order Aging Buckets
  • Preventive Maintenance Due Report
  • Work Order Components Pick List
  • Work Order Backlog & Aging
  • Work Order Turnaround (Closed Only)
  • Work Order Cost Summary & Distributions Reports

  • Zero On-Hand Items with Open Work Orders

Bridge the Gap Between Planning and Doing

This workspace ties project planning directly to execution—ensuring that tasks are scheduled, materials are ready, and teams are mobilized on time. Gain full visibility from the estimate to the dispatch, all in one system.
Work smarter. Move faster. Deliver consistently.

Work Orders Reports

Streamline labor and material requirements into structured work orders. Link execution directly to the project scope, estimate, and progress tracking.

Inventory Requisitions Reports | FireFlight
Last updated: April 2026

Inventory Requisitions Reports

Lead times, open POs, cycle time, supplier spend, and two-way match all from your live data, in one place, without exporting anything.

FireFlight's inventory requisitions reporting suite covers the full procurement cycle: from requisition creation through PO issuance, receipt, and supplier match. Six reports run directly against your live data. No scheduled exports, no manual pulls, no waiting for IT to build something. Most operations are up and reporting in weeks, not months.
Inventory requisitions reporting dashboard in FireFlight showing live procurement data

If your procurement team is still reconciling POs in spreadsheets, the cost of that process goes well beyond the hours spent. Missed discrepancies in receiving, aging purchase orders that no one is tracking, supplier spend that no one has visibility into by category these are operational liabilities that FireFlight's requisitions reports are specifically built to remove.

Schedule your free consultation

Why can't I just pull this from my ERP or accounting system?

Most mid-size operations run procurement data through two or three disconnected systems: a purchasing module, a receiving log, and an accounting platform that was never designed to connect the two. The result is that the people who need to know whether a PO has been received are running down answers manually, and the people responsible for supplier spend have no reliable way to see it by category in real time.

FireFlight connects requisition records, PO status, receipt confirmation, and supplier data in a single environment. The Lead-Time Analysis report measures actual PO-to-receipt elapsed time per supplier and per item category, which gives procurement managers the data they need to hold vendors accountable rather than estimating based on past experience. That single report often changes supplier conversations within the first quarter of deployment.

Unified material intelligence view in FireFlight showing supplier and category data

The Spend by Supplier and Category report gives operations and finance teams a view they typically cannot get without significant manual work: procurement spending cut by vendor and by material type simultaneously. For operations running multiple sites or managing a broad supplier base, this report is what makes annual contract reviews and budget forecasts credible.

Requisition Cycle Time rounds out the picture. It tracks the elapsed time at every handoff in the procurement process, from the moment a requisition is created to when the item is received and logged. If approvals are the bottleneck, the data shows it. If a specific supplier consistently delays receipts past the expected window, that is visible before it becomes a shortage problem.

What does the Two-Way Match report actually catch?

Two-way match compares what was ordered on a purchase order against what was actually received. Quantity variances, unit cost discrepancies, and item specification mismatches are flagged automatically so they can be resolved before they move downstream into accounts payable or inventory valuation. For operations that process significant receiving volume, this is the report that pays for the deployment.

Without automated matching, discrepancies get absorbed silently. Receiving records slightly off from the PO get approved because no one has time to audit every line. FireFlight flags them at the point of receipt, while the supplier relationship and the transaction are still active. The difference between catching a discrepancy at receipt versus three months later in a reconciliation is significant in both time and cost.

Every report runs against live data. There is no reporting database that needs to be refreshed, no nightly sync, and no time window during which the numbers are stale. When a purchase order is updated or a receipt is logged, every downstream report in FireFlight reflects it immediately.

PCG has been building procurement and inventory systems since 1995. The requisitions reporting suite in FireFlight reflects 31 years of watching where procurement data breaks down in real operations and designing specifically around those failure points.

How do these reports connect to the rest of the inventory system?

Requisitions reports in FireFlight share the same data foundation as inventory stock levels, supplier records, and fixed asset management. An open PO that is aging does not exist in isolation from the stock level of the item being ordered. The reporting layer is designed to surface those connections rather than treating each report as a standalone view.

For operations tracking materials across multiple locations, the PO Aging report filters by site. Procurement managers at each location see their own outstanding orders without sorting through data that is not relevant to their work. Central operations gets the consolidated view. Both pull from the same live records, so there is no version conflict between what a site-level manager sees and what appears in the corporate summary.

Ikhana on-screen guide
Meet Ikhana

Your Personal Guide on Every Page

From the first click to the final step, Ikhana, your on-screen tutor, shows you how it all works. Every field, every button, every page explained with clarity, right where you need it.

On the requisitions reports pages, Ikhana walks you through filter configuration, date range selection, and how to read match discrepancy flags. New team members get to useful output on day one rather than week two.

Learn more about Ikhana

What the six reports give your team

  • FireFlight Lead-Time Analysis (PO to Receipt). Measures actual elapsed time between PO issuance and item receipt by supplier and category. Identifies which vendors are consistently late versus which meet their stated lead times, giving procurement teams verified data for supplier reviews.
  • FireFlight Open Purchase Orders and PO Aging. Shows all outstanding POs sorted by age, with filters for site, supplier, and category. Aging orders past their expected receipt date are flagged so procurement managers can follow up before stock levels are affected.
  • FireFlight Requisition Cycle Time. Tracks elapsed time at each stage of the procurement process from requisition creation through approval, PO issuance, and receipt. Approval bottlenecks and supplier delays both show up in the same report, in the same time units.
  • FireFlight Spend by Supplier and Category. Breaks procurement spending down by vendor and material type simultaneously. Supports annual contract reviews, budget forecasting, and supplier consolidation decisions with actual transaction data rather than estimates.
  • FireFlight Two-Way Match. Compares purchase order line items against received inventory records and flags quantity variances, cost discrepancies, and specification mismatches at the point of receipt, before they reach accounts payable or inventory valuation.
  • FireFlight Procurement summary view. Provides a consolidated view of procurement activity across all six report types, giving operations managers a single starting point for the daily review without opening individual reports until a specific issue requires attention.

What PCG learned building procurement systems across 31 years: the reports that actually get used are the ones that take less than 30 seconds to produce and answer a question the manager was already going to ask. Every report in the requisitions suite was built around that constraint.

Procurement reporting fails not because the data is missing but because accessing it requires more effort than the alternative, which is asking someone who already knows. FireFlight removes that tradeoff. The data is available immediately, to anyone with access, without a request queue.

What operations see after deployment

  • FireFlight Procurement teams stop reconciling POs manually and start managing by exception. The Two-Way Match report catches discrepancies automatically so the team focuses on resolving issues rather than finding them.
  • FireFlight Supplier conversations become data-driven. Lead-Time Analysis gives procurement managers verified elapsed times per vendor, which changes what gets discussed in contract reviews and what gets renegotiated.
  • FireFlight Budget owners get accurate spend by category without waiting for a finance team to pull it. The Spend by Supplier and Category report runs in seconds from live data, with no manual aggregation required.
  • FireFlight Aging purchase orders get caught before they create shortages. The PO Aging report surfaces overdue orders early enough for procurement to act, rather than after a stockout has already affected production or delivery.

Questions buyers ask before deploying requisitions reporting

FireFlight What reports are included in FireFlight inventory requisitions reporting?
+
FireFlight includes Lead-Time Analysis (PO to Receipt), Open Purchase Orders and PO Aging, Requisition Cycle Time, Spend by Supplier and Category, and Two-Way Match reports. Each report pulls from live data in your FireFlight environment with no manual exports required.
FireFlight How does the Two-Way Match report work in FireFlight?
+
The Two-Way Match report compares purchase orders against received inventory line by line. Discrepancies in quantity, unit cost, or item specification are flagged automatically so your team can resolve them before they affect downstream billing or compliance records.
FireFlight Can I see how long it takes from requisition to purchase order to receipt?
+
Yes. The Requisition Cycle Time report tracks the full timeline from requisition creation through PO issuance to final receipt. You can filter by supplier, category, site, or date range and see exactly where delays occur in your procurement chain.
FireFlight What does the PO Aging report show?
+
The Open Purchase Orders and PO Aging report shows every outstanding PO sorted by age, with visibility into which are past expected delivery, which suppliers have the most open orders, and which items are the most overdue. It is designed to help procurement teams act before shortages affect operations.
FireFlight Can the Spend by Supplier report break down costs by category?
+
Yes. The Spend by Supplier and Category report lets you view procurement spending cut two ways simultaneously: by vendor and by material or service category. This makes supplier consolidation decisions and budget reviews considerably faster.
FireFlight Does FireFlight require a separate BI tool to generate these reports?
+
No. All inventory requisitions reports are built into FireFlight and run directly against your live data. There is no separate BI layer, no data warehouse, and no scheduled export job. Reports are available the moment a transaction is recorded.
FireFlight How long does it take to deploy FireFlight requisitions reporting for my operation?
+
Most deployments configure requisitions reporting in weeks, not months. The timeline depends on how many procurement categories, supplier relationships, and site locations are involved. PCG handles the configuration and data migration. You do not rebuild your processes from scratch.

If your procurement team is managing PO tracking and supplier reconciliation manually in 2026, the cost of that process is real and measurable. FireFlight's requisitions reports connect your purchasing, receiving, and supplier data in a single environment. Setup takes weeks, not months, and every report runs live from day one.

Schedule your free consultation

Allison Woolbert
Allison Woolbert
Principal, Phoenix Consultants Group  |  Developer, FireFlight Data Systems

PCG founded 1995. 500+ applications built across 31 years, roughly one-third in regulated environments where software failure carries direct operational and compliance consequences. FireFlight is the platform built from that body of work. When you contact PCG, Allison is the person who answers.

phxconsultants.com LinkedIn

FireFlight Data Systems is a product of Phoenix Consultants Group. PCG founded 1995. All system configurations are custom-built for each deployment. Implementation timelines, module availability, and integration scope vary by organization. Contact PCG directly to discuss requirements specific to your operation.

Inventory Requisitions Reports

Enable scanning across locations, processes, and transactions. Simplify physical handling and reduce errors with built-in barcode support.

Assets Reports: 20 Prebuilt Reports for Asset Management and Maintenance Teams | FireFlight
Last updated: April 2026

Assets Reports: 20 Prebuilt Reports for Asset and Maintenance Teams

Inventory status, compliance gaps, work order performance, and cost tracking. All reading from live EAM data. Ready on day one.

FireFlight Assets Reports gives maintenance supervisors, operations managers, and compliance officers 20 prebuilt reports covering asset inventory, work order performance, PM compliance gaps, and cost tracking. Every report reads from live EAM data. In 2026, maintenance teams waiting on IT to answer a basic question about their own operation are losing time they do not have. These reports exist so that question gets answered in seconds.
Assets Reports clarity through reporting

If your maintenance team is going into a weekly review without a clear picture of what work orders are open, what PMs are overdue, and which assets are driving the most repair activity, the Assets Reports workspace is the fix. Twenty reports. Live data. No setup required after deployment.

Schedule your free consultation

What are the 20 prebuilt reports in this workspace?

The 20 reports are organized across four operational areas. Each area covers a distinct set of questions that maintenance, operations, and finance teams need answered regularly. The grouping below shows which reports belong to each area and what problem each one was built to address.

Asset Inventory and Status

Where are your assets and what is their current state?

  • Active Asset Count by Site - Total active assets at each location. For multi-site operations, this is the baseline inventory check.
  • Simple Assets - Full asset list with location, owner, and status. The starting point for any portfolio review.
  • Recently Commissioned Assets (last 30 days) - Assets added to the portfolio in the current month. Confirms new acquisitions are registered correctly at the point of entry.
  • Assets Moved in Last 14 Days - Location changes recorded in the past two weeks. Useful for operations with high asset mobility across sites.
  • Assets Missing Serial or Tag (data quality) - Asset records without a serial number or asset tag. Run this before an audit to identify data quality gaps while there is still time to correct them.

Compliance and Gap Detection

What is overdue, expiring, or missing from the maintenance program?

  • Assets With No PM Schedule (gap finder) - Assets that are active but not assigned to any preventive maintenance schedule. These are the assets that will generate corrective work orders eventually.
  • Assets Without Inspection in 180 Days - Assets that have not been inspected in the past six months. Run before any compliance audit to identify gaps before an auditor does.
  • Overdue PMs (detail rows) - All past-due preventive maintenance events with full detail rows. The documentation trail most often requested in a maintenance compliance review.
  • PM Due in Next 7 Days (quick) - Upcoming PMs for the current week. Run every Monday morning. The list that drives daily scheduling decisions.
  • Recent Failed Inspections (last 30 days) - Inspections that produced a failed result in the past month. Shows what was flagged and whether corrective action has been initiated.
  • Warranty Expiring in Next 90 Days - Assets whose warranty coverage lapses in the next three months. Gives finance and procurement time to act before coverage expires.

Work Order and Maintenance Performance

How is the maintenance program actually performing?

  • Open Work Orders by Status (backlog snapshot) - Current WO backlog grouped by status. The weekly operations meeting report.
  • WO Aging (simple) - Open work orders sorted by how long they have been open. Identifies jobs that are stalling before they become a backlog problem.
  • Open WOs Missing Parts (no materials issued) - Work orders that are open but have no materials issued against them. These jobs cannot proceed until parts are confirmed. Run before scheduling to avoid dispatching technicians to jobs that are not ready.
  • First-Time Fix Proxy (no return WO within 7 days) - Closed work orders that did not generate a return WO within one week. A proxy measure for repair quality without requiring a separate quality tracking layer.
  • Hot Assets (most WOs in last 90 days) - Assets generating the highest work order volume over the past 90 days. The data point that supports a capital replacement conversation.
  • Corrective vs Preventive WO Mix (last 90 days) - The ratio of reactive to scheduled maintenance over the past quarter. A high corrective percentage is the measurable indicator of an under-resourced PM program.

Cost and Labor

What is maintenance costing and where is the time going?

  • Quick Asset Cost (WO charges, current month) - Work order charges posted to assets in the current month. The fast view of where maintenance spend is going before the month closes.
  • Parts Usage - Last 30 Days (by WO line) - Parts consumed against work orders in the past 30 days, at the work order line level. Connects parts consumption to the jobs that consumed them.
  • Labor Hours - Last 7 Days (by tech) - Technician labor hours logged in the current week, grouped by person. For operations managers reviewing technician utilization against scheduled capacity.

Which reports are most useful for compliance and audit prep?

Four reports in the compliance and gap detection group are specifically worth running before any maintenance audit or regulatory inspection. Assets Without Inspection in 180 Days identifies the gaps an auditor will look for before they look for them. Overdue PMs with detail rows provides the documentation trail most maintenance compliance reviews request. Recent Failed Inspections shows what was flagged in the past month and whether corrective action followed. Warranty Expiring in Next 90 Days gives finance teams the advance notice they need to act before coverage lapses.

The data quality report, Assets Missing Serial or Tag, is not a compliance report by name but it functions as one in practice. An asset record without a serial number or tag is an asset that cannot be traced in a physical audit. Running this report in advance of any physical count and correcting the gaps before the count starts is the difference between an audit that closes cleanly and one that generates findings.

All of these reports read from the same timestamped records that carry the audit trail. The figures a compliance officer sees in the report are the same figures an auditor would find in the underlying EAM records.

Asset cost and performance analysis reporting

Audit trail integrity: the reports and the records are the same data

Every report in the Assets Reports workspace reads from the same transactional records that carry the EAM audit trail. There is no separate reporting database to keep synchronized and no risk of a report showing figures that diverge from the underlying transactions. When an auditor asks for documentation of overdue PMs, the Overdue PMs report and the underlying maintenance records are reading from identical data.

The timestamps on work orders, inspection records, and PM completions are built into the record structure at the moment of transaction. They are not added retroactively. For operations subject to regulatory review, that means the compliance documentation exists and is current without any additional record-keeping effort beyond the normal maintenance workflow. PCG has been building maintenance and compliance systems for regulated industrial operations since 1995.

Which reports help catch maintenance problems early?

Several reports in the work order and compliance groups are designed specifically to surface problems before they become failures or audit findings. Understanding when to run each one is what makes the reporting workspace useful rather than just informational.

  • FireFlight Assets With No PM Schedule is the gap finder for the preventive maintenance program. Every active asset that appears on this report is an asset that will eventually generate an unplanned corrective work order. Running it monthly and closing the gaps is less expensive than running it after the first failure.
  • FireFlight Hot Assets identifies the assets generating the most work orders in the past 90 days. An asset that has required five corrective repairs in three months is a capital replacement conversation that should already be happening. The report provides the frequency data that converts that conversation from an opinion into a business case.
  • FireFlight Open WOs Missing Parts prevents the specific failure mode where a technician is dispatched to a job that cannot proceed because required parts were never issued. Running this report before the daily dispatch schedule is set catches those jobs before the truck rolls rather than after.
  • FireFlight Corrective vs Preventive WO Mix provides a measurable baseline for whether the PM program is actually preventing failures. If the corrective percentage is rising quarter over quarter, the PM schedule is either under-resourced or not being followed. The report makes that trend visible before the maintenance budget reflects it.
  • FireFlight WO Aging identifies open work orders that are stalling before they become a backlog problem. A work order that has been open for three weeks without progress has a reason. The aging report surfaces those jobs so a supervisor can investigate before the delay compounds into a compliance or operational issue.

How do the cost and labor reports connect to financial planning?

The three cost and labor reports in the Assets Reports workspace are designed for operational use during the month rather than for end-of-month reconciliation. Quick Asset Cost gives operations managers a current-month view of work order charges by asset before the month closes and the figures are locked. That visibility is what allows a manager to catch a cost overrun on a specific asset category while there is still time in the period to investigate it.

Parts Usage by work order line connects parts consumption to the specific jobs that consumed them. For maintenance operations that have experienced parts inventory drift, where the system shows stock that is not physically present, this report identifies which work orders consumed the parts and when. That connection is also what makes cost-per-repair calculations accurate at the work order level rather than estimated at the asset category level.

Labor Hours by technician is the weekly view of time logged against work orders by person. For operations managers reviewing technician utilization against scheduled capacity, the report shows where time actually went during the week. An operation running at 60% billable labor utilization and wondering why the maintenance backlog is not shrinking finds the answer in this report faster than in any other view in the system.

What PCG has learned across 31 years of maintenance reporting implementations

The pattern that appears most consistently in maintenance reporting is this: the data operations teams need to make good decisions already exists in the system. The problem is that getting to it requires either building a custom query, waiting for IT to run a report, or exporting data to a spreadsheet and assembling the view manually. Each of those paths adds latency between the question and the answer. The 20 prebuilt reports in the Assets Reports workspace exist to close that latency for the questions maintenance and operations teams ask every week.

The second consistent finding: organizations that have been running maintenance programs without a Corrective versus Preventive WO Mix report tend to underestimate how reactive their programs actually are. A program that feels like it is mostly scheduled preventive work is often running at 60% or more corrective when the work order data is actually measured. That finding changes maintenance budget conversations because it connects the reactive work rate directly to the additional cost per repair event that corrective work generates compared to scheduled work.

What changes when maintenance teams have these reports on day one?

The operational improvements from having live, prebuilt reports available from go-live are measurable and specific.

  • FireFlightWeekly operations reviews start with current data rather than with the question of whether the numbers from last week's export are still accurate
  • FireFlightCompliance gaps are identified before an audit rather than during one, which changes the outcome of the audit
  • FireFlightCapital replacement requests are supported by actual work order frequency data rather than by a supervisor's recollection of how often an asset has been repaired
  • FireFlightDispatchers stop sending technicians to jobs that cannot proceed because parts are not confirmed, because the Open WOs Missing Parts report is part of the morning workflow
  • FireFlightData quality issues in the asset registry are caught before a physical audit rather than discovered during one
  • FireFlightWarranty reimbursement opportunities are not missed because the expiration report gives 90 days of advance notice rather than zero

The Assets Reports workspace is part of FireFlight EAM and is available from go-live day. There is no setup phase for prebuilt reports. They read from the records the operation is already maintaining through normal maintenance workflows. Most EAM deployments are operational in weeks, not months, which means live reporting starts in weeks, not months after a separate reporting configuration phase.


Frequently Asked Questions

FireFlightWhat reports are included in the FireFlight Assets Reports workspace? +
The Assets Reports workspace includes 20 prebuilt reports covering four operational areas: asset inventory and status (active counts by site, recently commissioned assets, assets moved in the last 14 days, data quality flags), compliance and gap detection (overdue PMs, assets without inspection in 180 days, warranty expiring in 90 days), work order and maintenance performance (open WO backlog, WO aging, hot assets, corrective versus preventive mix), and cost and labor (current month WO charges, parts usage, technician labor hours).
FireFlightHow do the Assets Reports help with audit preparation? +
Several reports are specifically built for audit readiness. Assets Without Inspection in 180 Days identifies compliance gaps before an auditor does. Recent Failed Inspections shows what was flagged in the last 30 days. Warranty Expiring in Next 90 Days gives advance notice before coverage lapses. The Overdue PMs report with detail rows provides the documentation trail an auditor typically requests. All of these pull from the same timestamped records that carry the audit trail.
FireFlightWhat is the Hot Assets report and when should I run it? +
Hot Assets shows the assets that have generated the most work orders in the last 90 days. Run it when a maintenance supervisor suspects a specific asset class is consuming disproportionate repair resources, or before a capital replacement meeting where the argument needs to be supported by actual work order frequency rather than estimates. The report identifies which individual assets are driving the most maintenance activity, which is the data point that turns a replacement request into a defensible business case.
FireFlightWhat does the First-Time Fix Proxy report measure? +
The First-Time Fix Proxy identifies work orders that did not generate a return work order within 7 days of closure. This is a proxy measure for maintenance quality. A high first-time fix rate means repairs are holding. A low rate means technicians are returning to the same asset shortly after closing a job. The report does not require a separate quality tracking system. It runs against the existing work order records and flags the pattern automatically.
FireFlightHow does the Corrective vs Preventive WO Mix report help maintenance planning? +
The Corrective versus Preventive WO Mix report shows the ratio of reactive maintenance to scheduled maintenance over the last 90 days. An operation where corrective work orders significantly outnumber preventive ones is running reactively, which costs more per repair event and produces more unplanned downtime. The report gives maintenance managers a measurable baseline for the PM program and tracks whether scheduling changes are actually shifting the mix over time.
FireFlightCan I run Assets Reports for a specific site or asset category only? +
Yes. Reports in the Assets Reports workspace can be filtered by site, asset category, technician, or time period depending on the report type. Active Asset Count by Site and Labor Hours by Technician are designed for site-level and person-level filtering respectively. For reports where filtering is not built into the prebuilt version, FireFlight's ad-hoc reporting tools allow the same underlying data to be queried with custom filters.
FireFlightHow current is the data in Assets Reports? +
Assets Reports reads from live EAM data. When a technician closes a work order, when a PM is completed, when an inspection is logged, or when an asset is moved, the relevant reports reflect that change on the next refresh. There is no separate reporting database to synchronize. PM Due in Next 7 Days always shows the current state of the maintenance schedule rather than a snapshot from the last time someone ran a batch update.

Ready to give your maintenance and operations teams 20 live reports that answer the questions they are currently waiting on someone else to answer for them?

Schedule your free consultation

Allison Woolbert
Allison Woolbert
Principal, Phoenix Consultants Group  |  Developer, FireFlight Data Systems

PCG founded 1995. 500+ applications built across 31 years, roughly one-third in regulated environments where software failure carries direct operational and compliance consequences. FireFlight is the platform built from that body of work. When you contact PCG, Allison is the person who answers.

phxconsultants.com LinkedIn

FireFlight Data Systems is a product of Phoenix Consultants Group. PCG founded 1995. All system configurations are custom-built for each deployment. Implementation timelines, module availability, and integration scope vary by organization. Contact PCG directly to discuss requirements specific to your operation.

Assets Reports

Capture purchase details, assign locations and owners, and manage each asset’s lifecycle status. Know what you own and where it’s deployed.