

Asset Cost and Performance Analysis: See What Every Asset Actually Costs
TCO, downtime costing, performance benchmarking, and cost center allocation in one connected workspace.

If your capital replacement decisions are based on estimates rather than actual cost history, or if your finance team is reconciling asset expenses manually against operational records each month, the Asset Cost and Performance Analysis workspace is the specific fix for both of those problems.
Schedule your free consultationWhat does Total Cost of Ownership actually include in FireFlight?
TCO in FireFlight is not a calculation run at the end of an asset's life. It accumulates in real time from the moment an asset enters the portfolio. Acquisition cost is the starting point. Every work order charge, parts replacement, downtime event, depreciation adjustment, and service contract payment posts to the asset record as it occurs. The TCO figure at any given moment reflects what the asset has actually cost from day one through today.
The comparison that drives capital planning is not what an asset originally cost. It is what keeping it running costs now, compared against what replacing it would cost on a forward basis. That comparison is available from inside the workspace at any point in the asset's lifecycle without building a separate financial model. Finance teams and operations managers are reading from the same cost history rather than reconciling two views of the same portfolio.
TCO analysis filters by asset, by asset class, or by location. A manager reviewing a fleet category sees the full cost picture for every asset in that category simultaneously. An operation running equipment at multiple sites sees cost by location without requiring separate tracking systems for each site.

How does downtime costing connect failures to financial impact?
Downtime Costing in FireFlight connects every unplanned outage recorded in Downtime Logs to a financial impact figure. When an asset goes offline, the duration is captured. The costing layer converts that duration into a financial value based on the production or service rates configured for that asset type. The result is attached to the asset record alongside the maintenance history that explains why the outage occurred.
That connection is what makes the case for a capital replacement request defensible rather than approximate. An asset that has accumulated significant downtime cost over eighteen months is not a budget conversation that requires estimating the impact. The figures are in the record. The maintenance supervisor requesting capital replacement and the finance analyst reviewing the request are looking at the same numbers.
Performance benchmarking runs alongside downtime tracking. Actual utilization rates, availability percentages, and maintenance frequency are measured against the targets configured for each asset class. Assets performing below benchmark are visible in the analysis without requiring a separate performance tool. The trend data accumulates over time, which means the question of whether a maintenance intervention actually improved performance has a measurable answer.

Financial integrity: the cost data and the operational records are the same data
Every cost figure in the Asset Cost and Performance Analysis workspace comes from the same transactional records that carry the EAM audit trail. Work order charges, depreciation adjustments, and account transactions are not copied into a reporting layer. They are read directly from the source records that maintenance, compliance, and finance teams maintain through their normal workflows.
For operations subject to insurance audit or regulatory review, that means the asset cost figures an analyst presents are the same figures that appear in the underlying maintenance and financial records. There is no reconciliation step between what the analysis shows and what an auditor would find. PCG has been building asset cost tracking systems for regulated industrial and infrastructure operations since 1995.
How does cost center allocation and forecasting work?
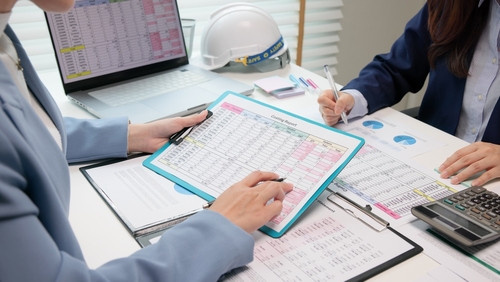
Accounts and Transactions in FireFlight allows asset expenses to be allocated across cost centers based on the rules configured for each asset class. An asset that serves multiple departments has its operating costs distributed to the appropriate budget lines automatically as transactions post. Budget planning and forecasting use actual asset behavior rather than assumptions from prior periods.
The forecasting layer uses the cost history accumulated in the asset record to project forward spending. An operations manager planning next year's maintenance budget builds it from what assets have actually cost over the past 12 to 24 months rather than from a percentage increase applied to last year's figures. That distinction matters when an aging asset class is consuming a rising share of the maintenance budget, because the trend is visible in the historical data before it appears as a budget overrun.
Account-level linking connects asset expenses directly to the financial accounts that carry them. Depreciation schedules run automatically and post to the correct accounts without a separate accounting entry. The financial alignment happens inside the same system as the operational tracking, which removes the monthly reconciliation step between the asset management system and the accounting system.

Your Personal Guide on Every Page
From the first click to the final step, Ikhana, your on-screen tutor, shows you how it all works. Every field, every button, every page explained with clarity, right where you need it.
In the Asset Cost and Performance Analysis workspace, Ikhana walks finance analysts and operations managers through TCO configuration, downtime costing setup, and cost center allocation without requiring a separate training session or documentation search.
Learn more about IkhanaWhat apps are included in this workspace?
The Asset Cost and Performance Analysis workspace includes ten apps covering every component of the cost and performance analysis lifecycle.


Workspace Highlights
 TCO analysis by asset, class, or location - Full cost history from acquisition through current period, filtered to the view that matters for the decision at hand.
- Downtime logs with cost attribution - Every unplanned outage connected to a financial impact figure based on the production or service rate configured for that asset type.
- Performance benchmarking for efficiency tracking - Actual utilization and availability measured against targets, with trend data that accumulates over time rather than requiring periodic manual measurement.
- Integrated depreciation and financial alignment - Depreciation schedules run automatically and post to the correct accounts without a separate accounting entry or a monthly reconciliation step.
- Budgeting, forecasting, and account-level linking - Forward budget planning built from actual asset cost history rather than from percentage increases applied to prior-year figures.
- Real-time dashboards and historical record analysis - Current-period snapshots and multi-year trend analysis available from the same workspace without switching between tools.
Connected enterprise systems
This workspace is fully integrated with the following enterprise systems inside FireFlight. Asset cost and performance data flows into each connected system without a manual export or reconciliation step.
 ERP (Enterprise Resource Planning)
 Compliance Management System
 System Infrastructure / Platform Tools
 Facility Management System
 Workforce / Workflow Management
What PCG has learned across 31 years of asset cost tracking implementations
The most consistent finding in asset cost implementations is that organizations discover their actual cost-per-operating-hour figures are significantly higher than their estimates once real transaction data starts accumulating. The gap between estimated and actual TCO is almost always present, and it is almost always larger than expected. The organizations that find it in the first quarter of using a connected cost tracking system are the ones that make better capital planning decisions in the second quarter. The ones that continue estimating continue making the same planning errors.
The second consistent pattern: operations where finance and maintenance are working from separate systems spend significant time each month reconciling cost figures that should agree but do not. That reconciliation effort produces figures that are already historical by the time they are reviewed. FireFlight's approach, where the cost layer reads from the same records as the operational layer, eliminates that cycle entirely. The reconciliation time goes away because there is nothing to reconcile.
"We can finally quantify the real cost of each asset. How much downtime hurts, where our money goes, and what is worth keeping versus replacing. That clarity changed how we present capital requests to leadership."Monica Reyes Asset Finance Analyst, public infrastructure operator
What changes once asset cost is tracked automatically?
- Capital replacement requests are supported by actual accumulated cost history rather than by estimates of what an aging asset has cost to maintain
- Downtime impact is measurable in financial terms, which converts maintenance conversations from operational discussions into budget discussions
- Monthly reconciliation between asset management records and accounting records stops, because both are reading from the same source
- Budget forecasting reflects actual asset behavior rather than prior-year percentages, which produces more accurate budget requests and fewer mid-year adjustments
- Cost center allocation happens automatically as transactions post, rather than through a manual distribution process at month end
- Finance and operations are looking at the same asset cost figures simultaneously, which removes the version mismatch problem from planning conversations
The Asset Cost and Performance Analysis workspace is part of FireFlight EAM. It connects to the same asset records, maintenance logs, and financial transactions that the rest of the EAM workspaces maintain. Activating it is a configuration step, not a separate implementation. Most EAM deployments are operational in weeks, not months. The cost analysis layer is available from go-live day, which means the financial visibility starts in weeks, not months after a separate analytics configuration phase.
Frequently Asked Questions
What does Total Cost of Ownership include in FireFlight Asset Cost and Performance Analysis?
How does downtime costing work in FireFlight?
How does cost center allocation work for assets that serve multiple departments?
What is the difference between the Asset Cost and Performance Analysis workspace and the Asset Dashboard?
Can FireFlight benchmark asset performance against targets or industry standards?
How does Asset Cost and Performance Analysis connect to ERP and financial systems?
Who uses the Asset Cost and Performance Analysis workspace?
Ready to replace estimated asset cost figures with a live financial view that accumulates automatically from the moment an asset enters the portfolio?
Schedule your free consultation
FireFlight Data Systems is a product of Phoenix Consultants Group. PCG founded 1995. All system configurations are custom-built for each deployment. Implementation timelines, module availability, and integration scope vary by organization. Contact PCG directly to discuss requirements specific to your operation.