

Dashboards: Your Whole Operation in One Live View
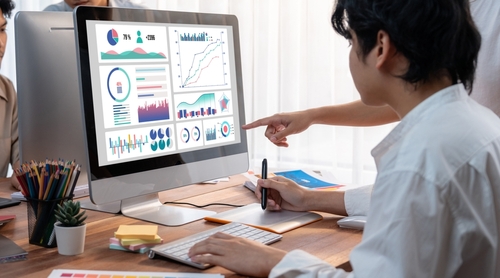
The Dashboards app pulls live data from across your system into interactive panels built by role. Track KPIs, statuses, plus real-time totals on one screen, so teams catch trends and act without digging through reports.
Why does it take so long to know where things stand?
The status of a business lives in a dozen places. Inventory is in one app, open work orders in another, receivables in a third, and the only way to see the whole picture is to open each one and add it up in your head. By then, the picture has already changed.
That lag costs you. A manager makes a call on a number that was true yesterday, or an exception sits unnoticed because nobody happened to open the right screen. In 2026, when a problem can compound in hours, finding out at the end of the week is finding out too late.
Dashboards put the whole pulse in one view. KPIs, statuses, exceptions, plus real-time totals, arranged for the role looking at them. The number on the screen is the number right now, not a snapshot from a report someone ran this morning.
How do the Dashboards stay live and relevant?
Every panel feeds from live data in any app or module, so a dashboard reflects the system as it stands, not a nightly export. You build the layout with a drag-and-drop editor that sizes itself for the screen, and you choose the widgets that fit: charts, gauges, counts, grids, plus summaries.
From there, the dashboard works for the person in front of it. Role-based widget permissions decide who sees what, alert indicators flag a threshold or an exception the moment it trips, and filters narrow the view by date range, tag, category, or status. You can embed a view on a homepage or export the visuals for a meeting.
Most deployments run in weeks, not months. Your data already lives in the platform, so a dashboard has something to show on day one. The team stops switching between apps to piece the picture together.
What apps do the Dashboards pull from?
 Inventory Control
 Accounts & Transactions
 Work Orders
 Time Tracking on Job
 Certifications
 Procurement
 Invoices & Quotes
 Custom Reporting
 Ad-Hoc Reporting
 Software Subscription Management
 Notes History
How is your dashboard data protected?
Dashboards run on the same platform that holds your data, hosted by Phoenix Consultants Group, not piped to a separate analytics tool you never vetted. Widget permissions are role-based, so a person only sees the panels and the numbers they are cleared to see.
An embedded dashboard respects those same limits, so a view shared on a homepage never exposes data beyond someone's permissions.
What do the Dashboards give your team?
 Dashboards customizable by role, department, or function.
- Live data feeds from any app or module.
- Charts, gauges, counts, grids, plus summaries to fit the data.
- A drag-and-drop layout editor with responsive sizing.
- Alert indicators for thresholds, goals, plus exceptions.
- Role-based widget permissions.
- Embedded views on homepages or inside app contexts.
- Filters for date ranges, tags, categories, plus statuses.
One glance at the dashboard and I know where everything stands. No chasing updates, no guesswork.Director of OperationsMulti-Branch Service Provider
Built by people who answer the phone
Phoenix Consultants Group has built custom software since 1995. About a third of that work has been operations and compliance tracking for environmental and industrial firms, where a missed exception can become a missed deadline. The Dashboards app comes from that experience.
The same platform now adds AI reporting. Instead of hunting through panels, your team can ask a plain-English question about what changed today and get an answer from the same live data, with no canned report and no waiting on IT. Most deployments still run in weeks, not months.
What changes operationally after deployment?
- One glance replaces opening five apps to check status.
- An exception gets flagged the moment it trips.
- Each role sees the numbers that matter to them.
- Decisions get made on live data.
- Nobody chases an update that is already on the screen.

Ikhana walks your team through every field
From the first click to the last entry, Ikhana sits on the page as your on-screen tutor. Every field, every button, explained the moment you need it. No thick manual, no support ticket.
Learn moreFrequently Asked Questions
Can FireFlight show our whole operation on one live dashboard?
Can FireFlight show our whole operation on one live dashboard?Is the data actually live?
Is the data actually live?Can I build a dashboard without a developer?
Can I build a dashboard without a developer?Can different roles see different dashboards?
Can different roles see different dashboards?Can a dashboard alert me to a problem?
Can a dashboard alert me to a problem?How long does it take to get the Dashboards app running?
How long does it take to get the Dashboards app running?
Phoenix Consultants Group. Founded 1995. FireFlight Data Systems is PCG's hosted platform. Last updated June 2026.







